
See your own weekly meeting on a dashboard
In the demo we build a few reports on sample data and talk about the numbers you want to see each week.
Pick the data, what you measure and how you break it down, and the preview appears straight away. Put reports on a dashboard for yourself or the whole team. Click a number and you see the deals behind it.
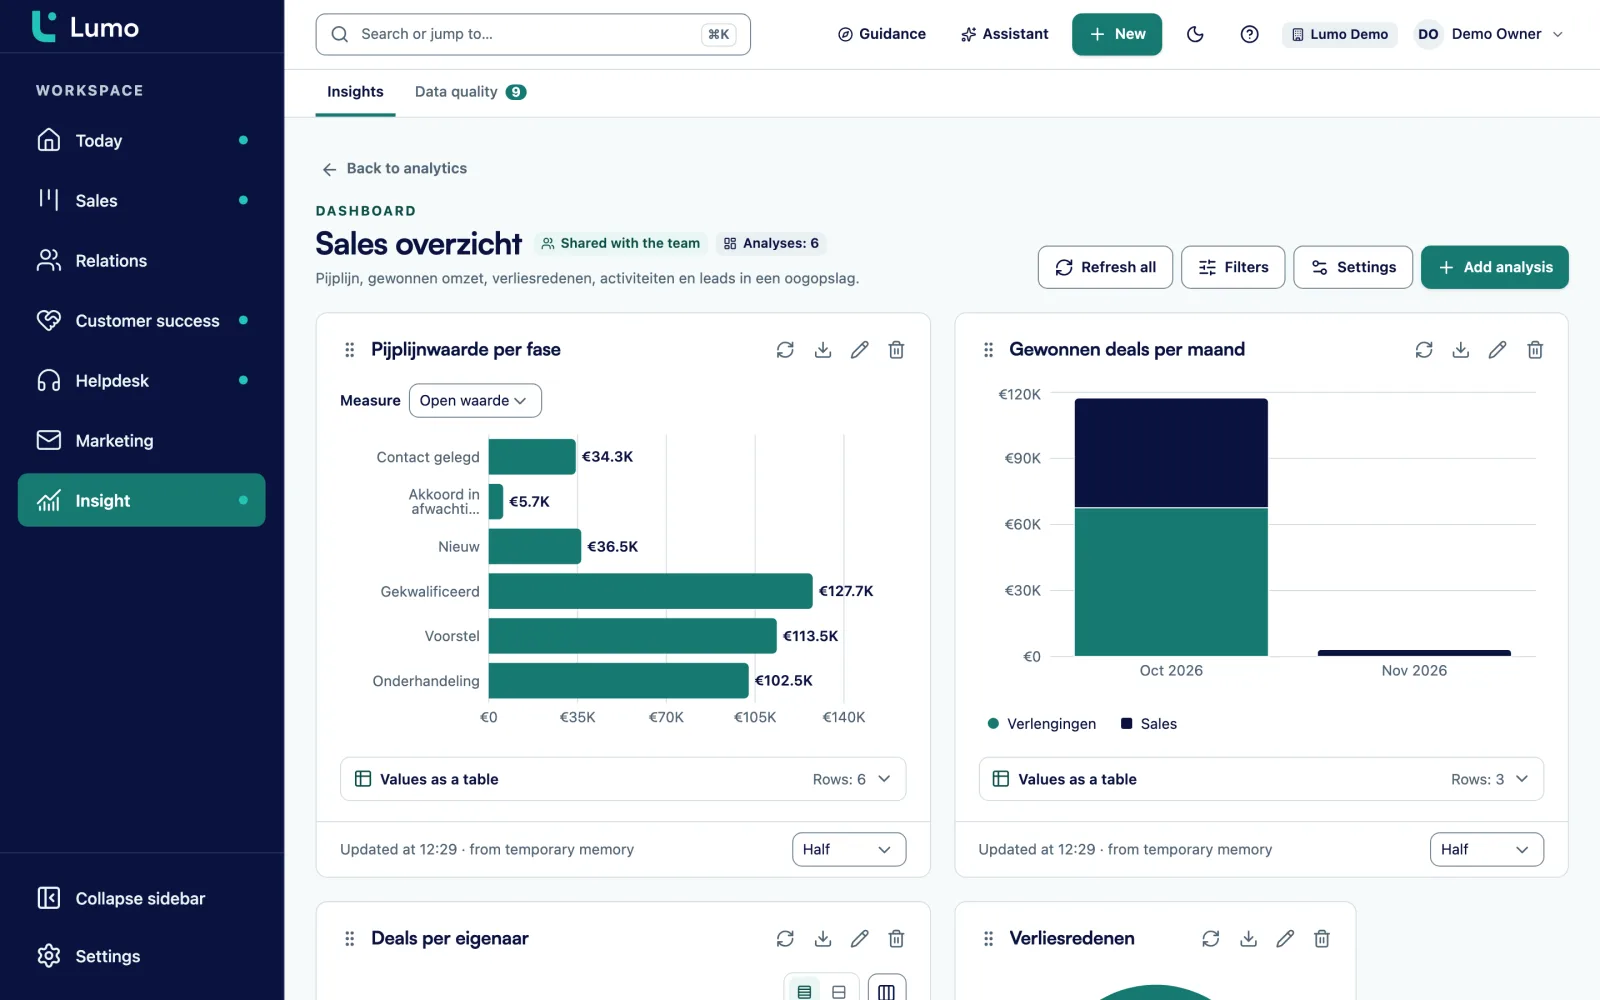
It is the first Monday of the month. The sales manager wants to know, before the ten o'clock meeting, how much was won last month per account manager and how much is still open in the Proposal stage. So at half past eight someone exports the deals from the CRM. They go into a spreadsheet, a pivot table goes on top, and at five to ten there is a chart in the slide deck.
In the meeting someone asks which deals make up the 40,000 in Proposal. Nobody knows, because the spreadsheet is a snapshot and the link to the deals is gone. A week later the number is already wrong. Two deals were lost and one slipped to next quarter. The meeting then turns into a debate about whether the number is right, rather than what the team should do about it.
That is the real cost of reporting outside the CRM. It takes time, it goes stale at once, and it cuts the number loose from the records. In Lumo you build the report on the data itself. You pick the data, such as deals, leads or activities. You pick what to measure: a count, a sum of deal value, an average or a ratio. And you pick the breakdown, such as owner, stage, pipeline or lost reason. The preview recalculates with every choice.
Put the report on a dashboard and everyone looks at the same number at the same moment. Click the Proposal bar in the meeting and you see the deals inside it. The conversation is about the deals again. If you want to know which numbers are worth tracking each week, read our guide on sales KPIs that drive decisions. For turning a pipeline into a prediction, see the guide on sales forecasting.
Open Analytics and start a new report. The builder has fixed blocks, from top to bottom.
Under Data you pick the source: deals, persons, organizations, leads, activities, pipelines, stages, lifecycle, lost reasons or members.
Under What you measure you choose count, distinct count, sum, average, lowest, highest or ratio. A ratio has a numerator and a denominator and gives a percentage.
Under Break down by you pick owner or stage, for example. With no breakdown you get a single number, which suits a key figure.
Pick a preset such as this quarter or this fiscal year, a rolling range such as the last 90 days, or your own dates.
Under Display choose one of nine charts, check the Preview and save. Then add the report to a dashboard.
The builder follows the questions you already ask. How many deals did we win this quarter, by owner? What is the average deal value per pipeline? How many activities did the team complete last week? Each of those is a mix of data, a measure and a breakdown.
You see the result as you build. If you pick a display that does not fit the breakdown, such as a funnel for a breakdown with no order, Lumo shows the report as a table and tells you why. You never have to guess why a chart stays empty.
If you sell in more than one currency, Lumo uses exchange rates, so a deal in dollars and a deal in euros can sit in the same total. Every report exports to CSV for anyone who wants the number in their own model.
A dashboard puts reports side by side, with filters that apply to all of them at once. Filter the dashboard to one pipeline and every report follows. Refresh all pulls in the latest numbers.
You decide whether a dashboard is only for you or shared with the team. A shared dashboard can be seen and used by everyone in the workspace. A sales manager builds one for the weekly meeting, an account manager builds one for their own deals.
The most useful part is the drill-down. Click a bar or a row and you get the underlying records: the deals, leads or activities that make up that number. From that list you open a deal and see its timeline, the last activity and the next step. A number turns into a work list.
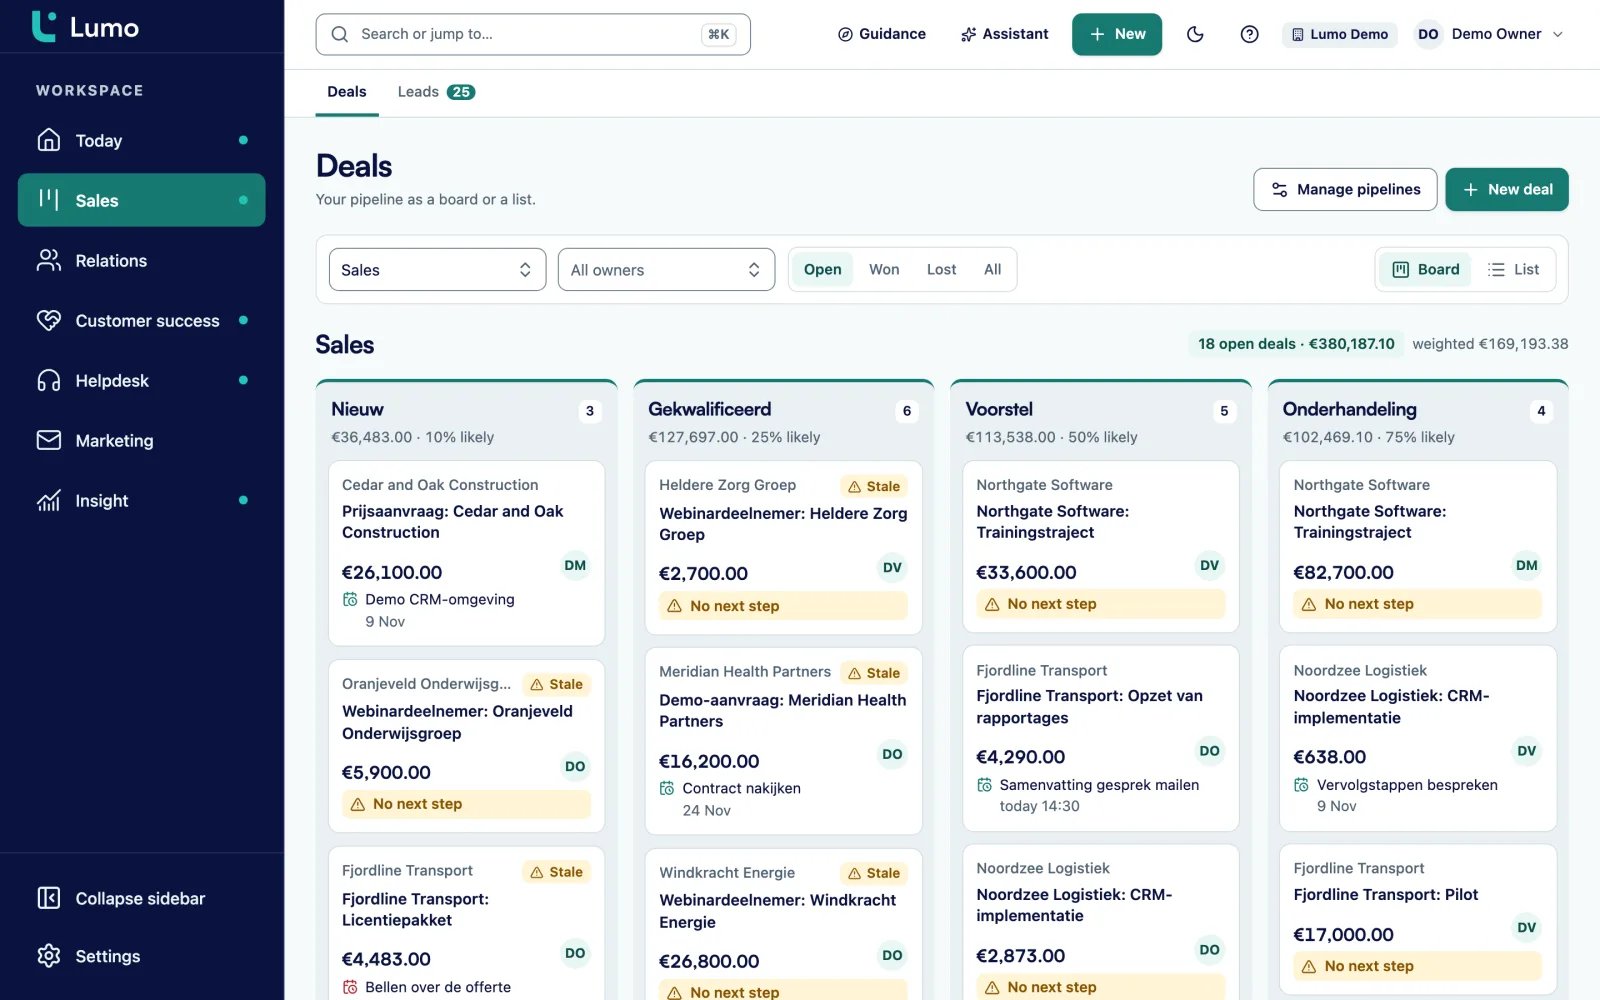
If you know what you want to see but not which measure and breakdown belong to it, describe the report in one sentence. For example: "What is our won revenue per month this year?" The assistant turns that into a proposal and loads it into the builder.
The assistant only proposes a report. It does not run or save anything. You review the proposal in the builder, fix what is off and save it once it is right. It is also a quick way to learn the builder, because you see which choices fit your question.
This uses the workspace AI assistant. It is off by default and an owner or admin turns it on. You can read how that works and where the data goes on the AI assistant page.
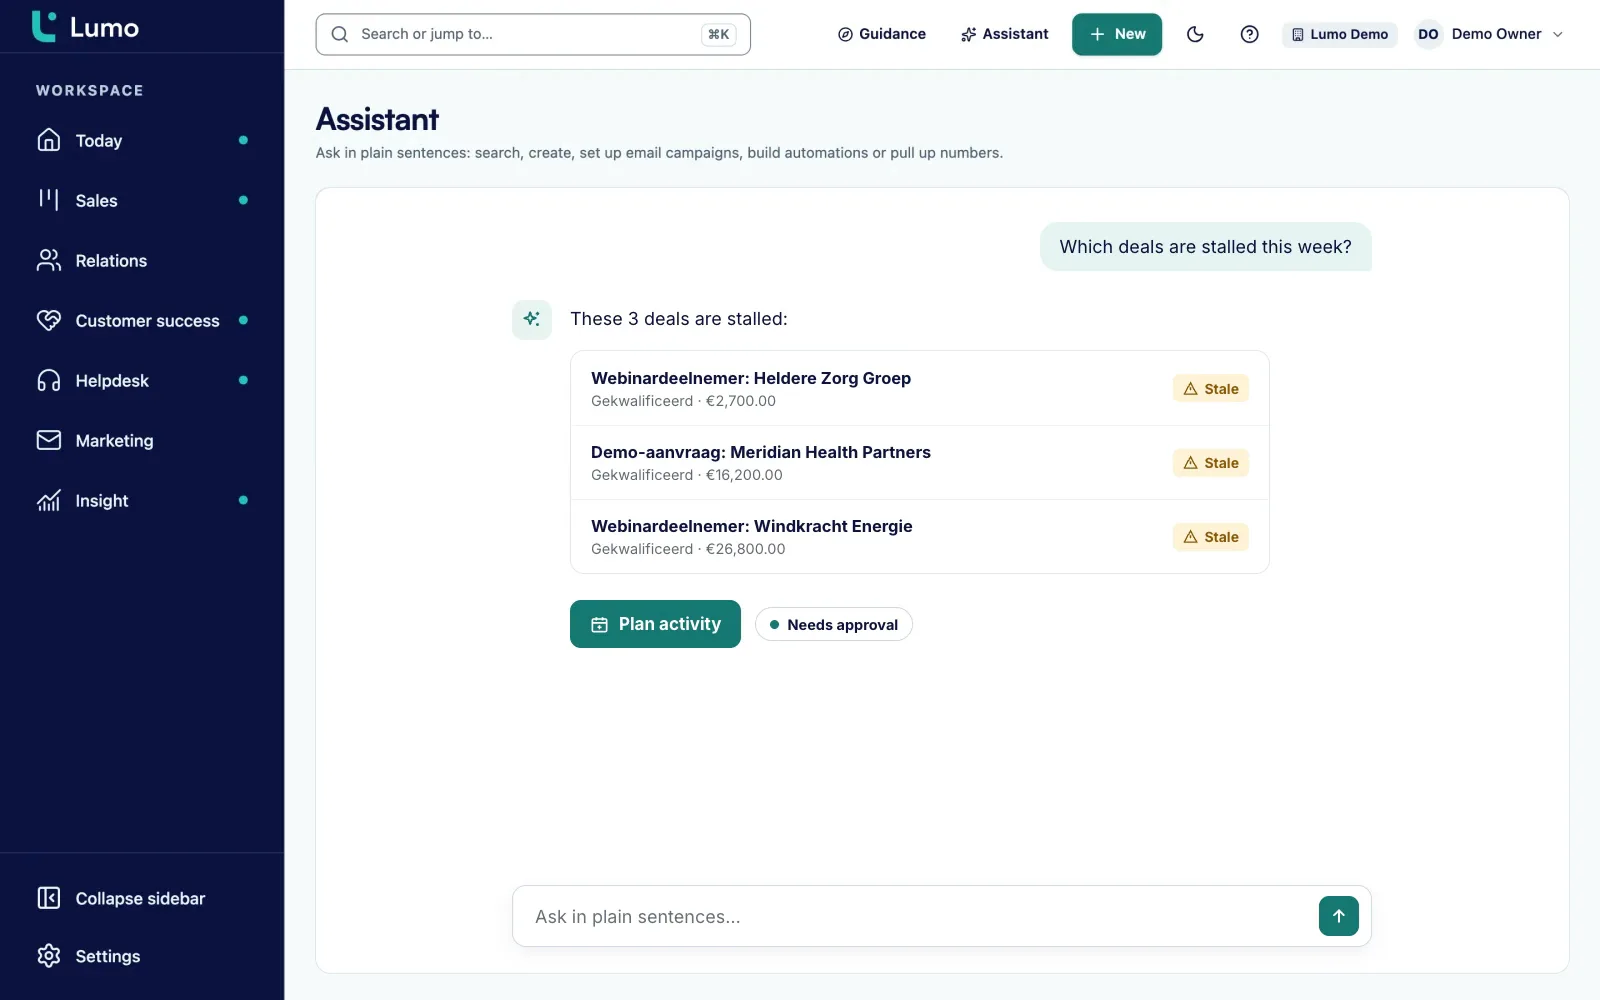
Key figure, bar chart, donut chart, funnel, waterfall, stacked bars, line, area and table. Any chart can switch to a table.
Presets from today to last fiscal year, a rolling range of days, weeks or months, or custom dates.
Add a goal to a line or bar chart and see how far the team is from it in each period.
Click a number to see the records behind it, with a button to open the full list.
Deals, persons, organizations, leads, activities, pipelines, stages, lifecycle, lost reasons and members.
Deals in their own currency count in the same total through exchange rates.
A report or dashboard is private or shared. Shared means everyone in the workspace can see and use it.
Describe what you want and the assistant prepares a proposal in the builder.
Say a distributor of technical parts has 12 account managers and two pipelines, one for new customers and one for growth at existing accounts. The sales director wants to know every Monday, in twenty minutes, where the team stands. This is an example of how that dashboard could look.
At the top sits a key figure with won deal value this quarter and a goal line at the quarterly target. Next to it a bar chart with won value per owner. Below that a funnel with the number of deals per stage in the new customer pipeline, so you see where deals get stuck. A table of lost deals by lost reason shows whether price, lead time or a competitor costs the most deals. And a line with completed activities per week shows whether the team has enough customer contact.
The dashboard gets a pipeline filter. In the meeting the director sets it to new customers first and then to growth. If one account manager has a lot of deals in Proposal, the director clicks that bar and opens the underlying records. It becomes a conversation about three specific deals and their next step.
For the weighted outlook the team builds a separate report: the sum of deal value times the win probability per stage, broken down by month of expected close date. You set the win probability per stage in your pipeline. There is no separate forecast screen. This report does that job.
This order works for most B2B teams. Start small and only add a report when there is a real question behind it.
A report is only as good as the data underneath. Stages and win probabilities come from pipeline management. Activities come from activities and calendar, including meetings that arrive from Google Calendar. Leads and their status come from lead management.
If fields are missing or deals are incomplete, the data quality rules in CRM adoption and guidance help. You can require, for example, that every deal has an expected close date. Duplicate organizations make totals per customer unreliable, and you merge those in duplicate management.
Sales managers have their own page on pipeline and team visibility. The page for RevOps and leadership goes deeper into a fixed set of numbers.
Today the report builder covers deals, persons, organizations, leads, activities and the data around them. Reports that combine tickets, campaigns, form submissions and chat are planned. Until then you find those numbers where they live: campaigns show sent, opened, clicked and unsubscribed, and the helpdesk has SLA and satisfaction. Scheduled email reports are not available yet, so agree on one dashboard the team opens. For products with recurring billing, a report line counts one period. And reports see every record in the workspace, including a colleague's deals.
Nine displays: key figure, bar chart, donut chart, funnel, waterfall, stacked bars, line, area and table. Every chart can also be shown as a table.
Yes, as a report. You sum deal value times the win probability per stage, broken down by month of expected close date. There is no separate forecast screen. The guide on sales forecasting explains the approach.
Yes. Every report exports to CSV, which opens in Excel or Google Sheets. Lists of deals, persons and organizations export to CSV as well.
Not yet. Agree on a shared dashboard the team opens, for example in the weekly meeting.
Not in the report builder yet. That is planned. Campaigns have their own stats, such as sent, opened, clicked, bounced and unsubscribed. More on campaigns
You decide. A dashboard is private or shared with the team. Shared means everyone in the workspace can see and use it.
Yes. Under period you pick this fiscal year or last fiscal year, next to presets, rolling ranges and custom dates.
Yes. A deal has its own currency and reports use exchange rates, so everything can sit in one total.
No. The builder works without AI. Report from a sentence is an extra route that only works when an admin has turned the assistant on.
In the demo we build a few reports on sample data and talk about the numbers you want to see each week.