
See your own pipeline in Lumo
In the demo we put your stages on the deal board and show what weighted value and rotting say about your deals.
The Lumo deal board shows count, value and weighted value per stage, and warns you when a deal sits still too long. Products calculate the deal value, and every stage change is stored.
Monday morning, weekly sales meeting. The sales manager opens the board and sees 84 open deals with a healthy total. Everyone nods. Then someone asks which deals will actually close this month, and the room goes quiet. Some of those 84 have been there since spring. On others the last email is three weeks old. And a few values were once guessed, because there was no quote yet.
That is what a pipeline often looks like in practice. It is full, but it says little. That is rarely because reps are lazy. It is because the system does not help. A deal that stalled looks exactly like a deal that was discussed yesterday. The value is a number someone typed, not the sum of what you really sell. And why a deal was lost is recorded nowhere, so nobody learns from it.
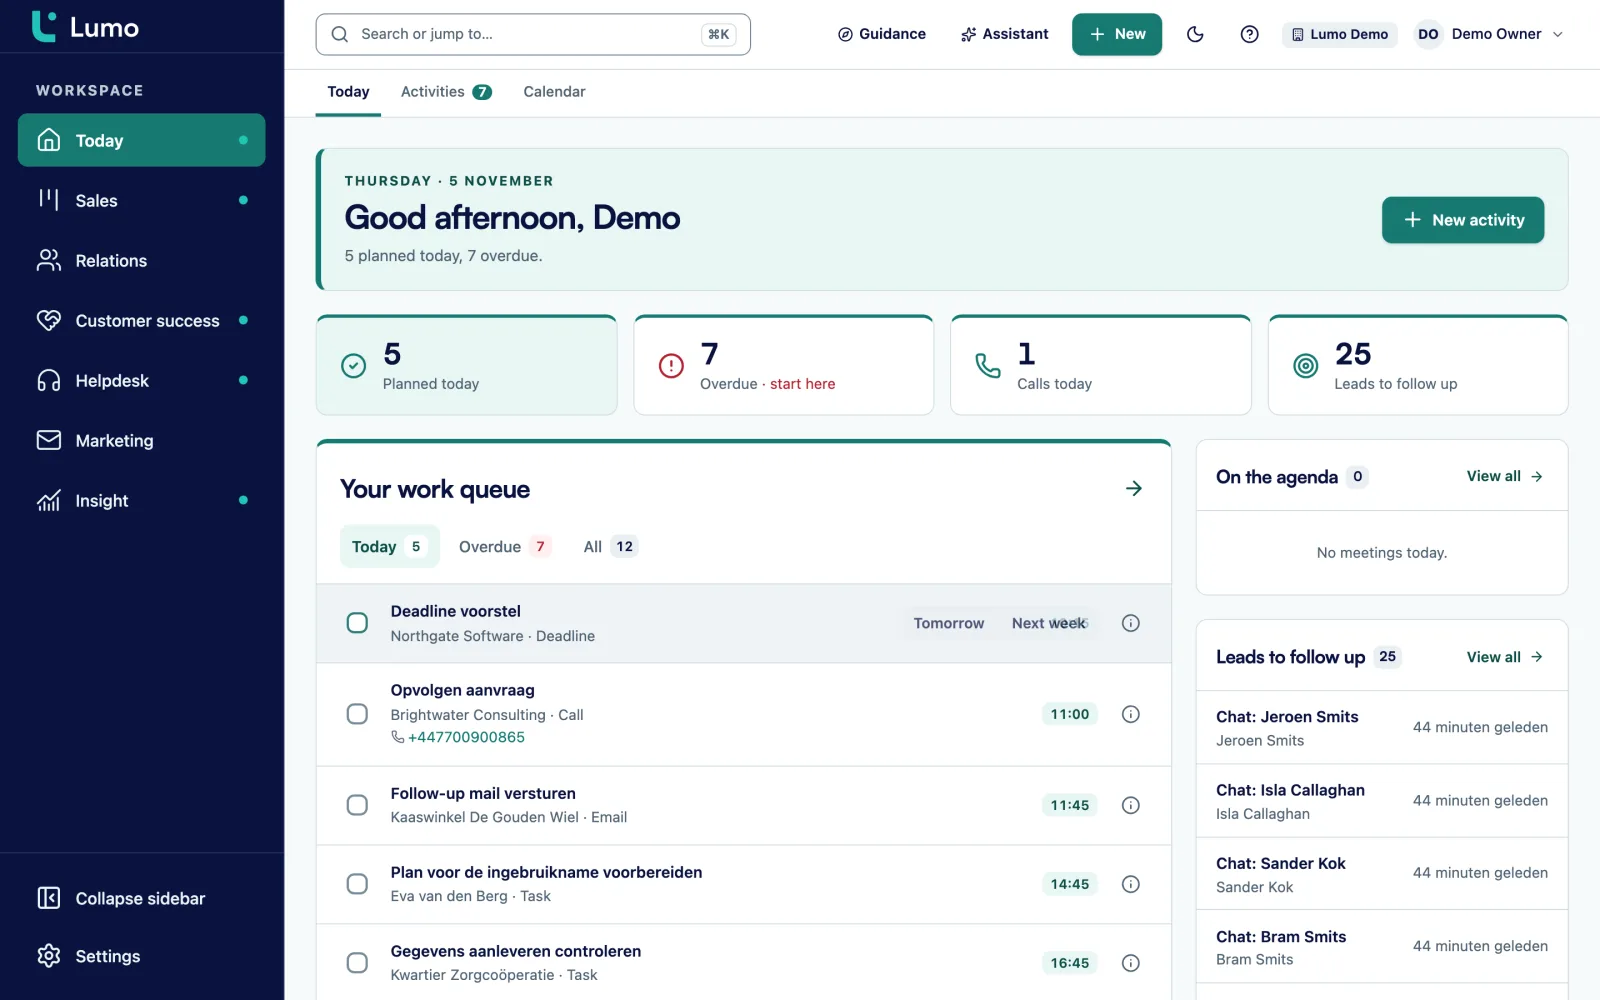
Good pipeline management means three things. You see per stage how much is there and how much of it is likely to come in. You see which deal has sat still too long, without keeping a list yourself. And afterwards you know how long deals spent in each stage and why you lost. That is what Lumo is built for.
In Lumo every stage gets a win probability and a number of days after which a deal is rotting. The board calculates with those. A deal that sits too long gets a signal on its card and shows up on the owner's Today screen. The value comes from the product lines as soon as you add them. And every move is stored with the time the deal spent in the previous stage. That turns the weekly meeting into a conversation about the deals that need attention, instead of a walk past everything. How to pick the stages themselves is covered in the guide B2B pipeline stages that work.
From a new deal to Won or Lost, with the buttons and statuses as they are named in Lumo.
Under Settings, Pipelines and products, create a New pipeline and add stages. Per stage you fill in Win probability, from 0 to 100, and Rots after (days).
New deal asks for the basics: title, pipeline, stage, contact person and organization. You fill in the rest on the deal page later. A lead becomes a deal with Convert to deal.
On the deal, choose Add product. Each line gets a quantity, price, discount and billing. The deal value becomes the Total of the product lines.
Plan an activity sets the next step. On the deal card it shows as Next step, or as No next step if you forgot.
Drag the deal on the Board to the next stage, or choose Move and then Move to a stage. Every move lands in the Stage history.
Choose Won or Lost. Lost asks for a Lost reason. Reopen brings a deal back.
At the top of every column on the deal board you see how many deals are in that stage, what they are worth together and their weighted value. Weighted value is the deal value times the win probability you set for the stage. A Proposal stage at 40 percent counts a 10,000 euro deal as 4,000 euro. Above the board is a summary of all deals, with the total and the weighted total.
Want the numbers side by side? Open the Totals per stage table. It lists count, value and weighted value per stage. Filter on owner to see one rep's board, and switch to the List view to see the same deals in rows.
A card shows the title, the organization, the value and the next step. The next step reads as overdue, today, tomorrow or a date. So you see at a glance which deals have no next step at all.
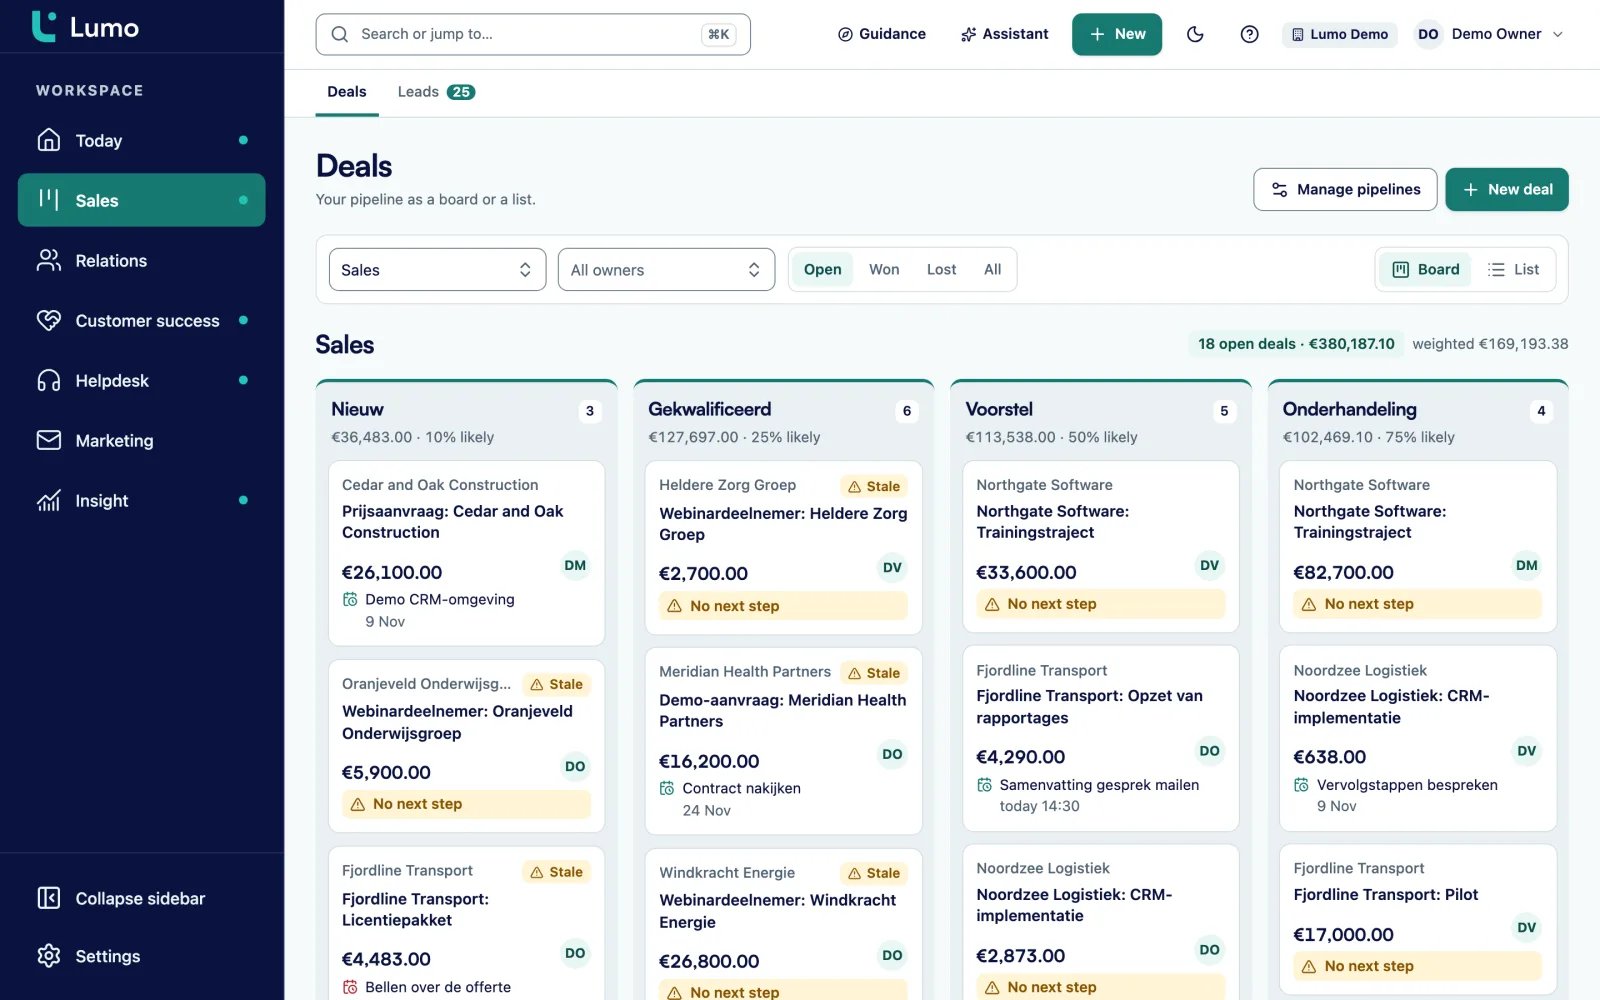
Per stage you set after how many days a deal is rotting. When a deal stays longer, it gets a Stale label on the board, with how many days it has been in the stage and how many days too long. A deal that moves on time shows nothing. So stagnation stands out without you looking for it.
Stalled deals also show up on the owner's Today screen. They sit next to that day's tasks and leads, so it is the first thing a rep sees. An automation takes it one step further: the "deal stale" trigger can create an activity after a number of days, or put a label on the deal.
Which period fits each stage depends on your sales cycle. A Discovery stage might rot after seven days, a Legal review stage after thirty. If a stage should never rot, leave the period empty.
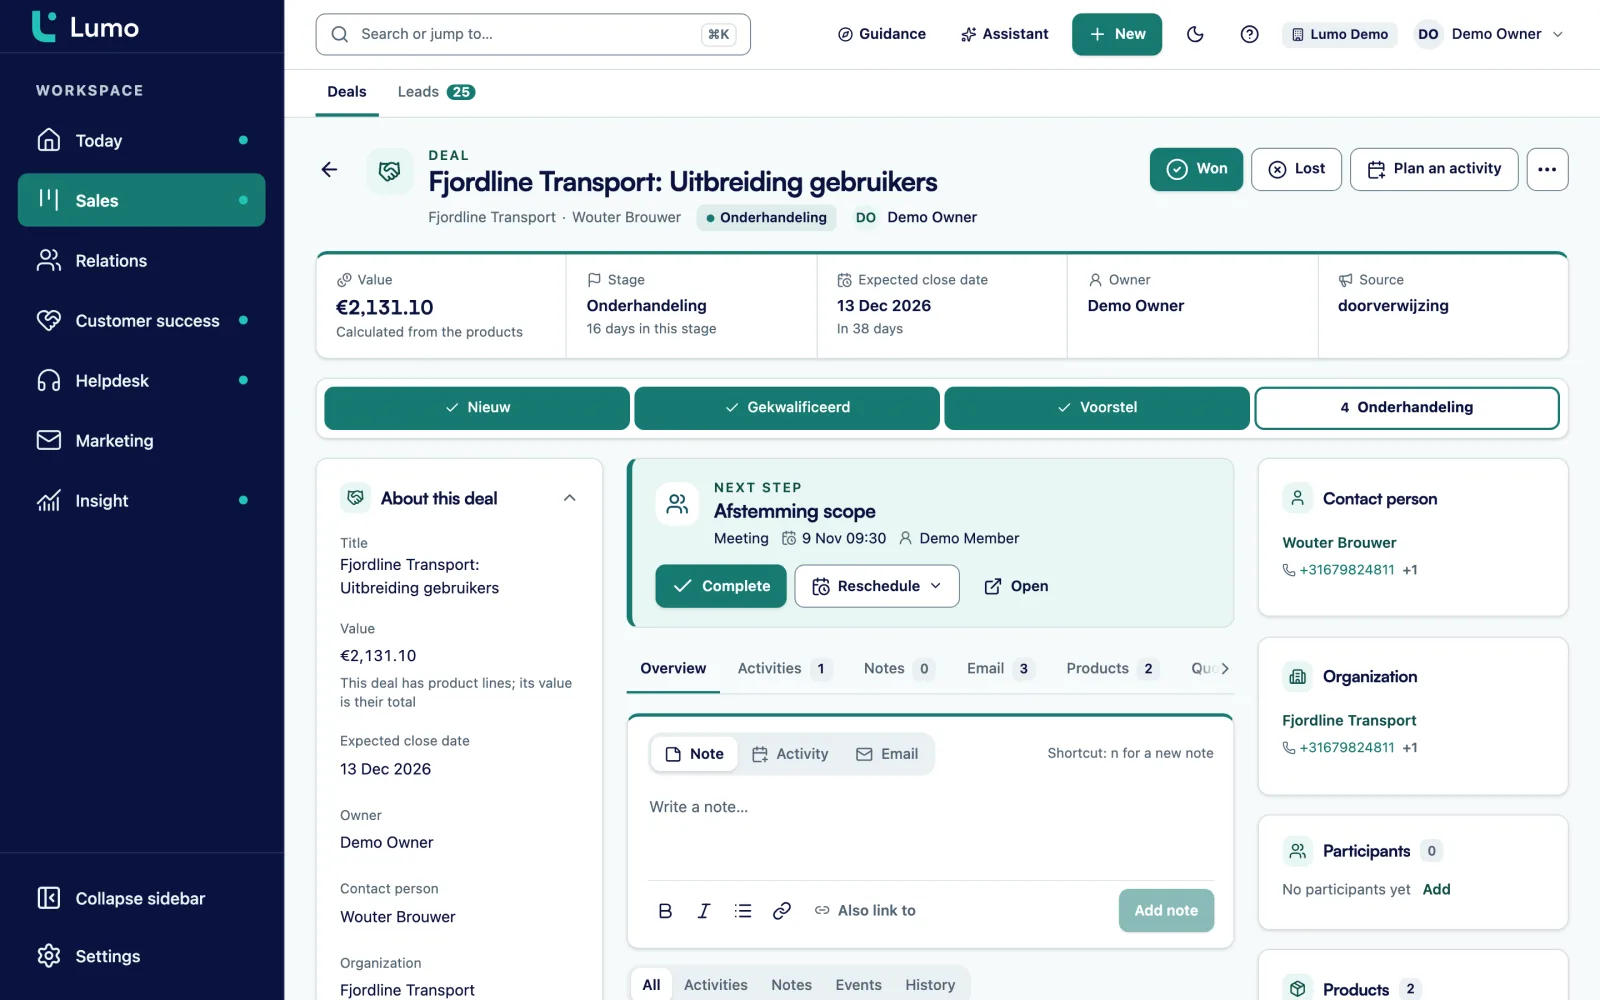
The deal page shows the progress through the stages at the top. Below are the details: value, currency, owner, contact person, organization and expected close date. Each deal can have its own currency, with a three-letter code such as EUR. Add participants when more people at the customer have a say.
Product lines calculate the value. Per line you choose the billing: one-time, weekly, monthly, quarterly, semi-annually or annually, with an optional number of cycles. A recurring line without cycles counts as one year. Once a deal has product lines, its value is their total and you no longer type it in.
The Stage history shows when the deal entered each stage and how long it stayed. On the right are the customer's tickets, so you know whether something is open before you call. From the deal you also create the quote.
For example New business and Renewals, each with its own stages. One pipeline is the default and cannot be deleted.
A number from 0 to 100 that drives the weighted value on the board and that you use in reports.
Its own rotting period per stage. Leave it empty and deals in that stage never rot.
Products with a price and their own code. On the deal you pick from the catalogue or add a one-off line.
Your own list in Settings. A lost deal without a reason is refused, so your loss report holds up.
Several people on one deal, for decision makers, buyers and users who join the conversation.
Twelve field types, from select to monetary and user, and any field can be required.
A closed deal only moves after Reopen, and a stage with deals or history cannot simply be deleted.
An example, not a customer story. Say a distributor of technical parts has twelve account managers. They sell to new customers and renew annual contracts with existing ones. Until now everything sat in one list, and nobody knew which deals were really moving.
They create two pipelines. New business gets five stages: Discovery (10 percent, rots after 10 days), Need confirmed (25 percent, 14 days), Proposal (40 percent, 14 days), Negotiation (70 percent, 10 days) and Awaiting sign-off (90 percent, 7 days). Renewals gets three stages with higher probabilities, because the buyer is already a customer.
An account manager has a deal in Proposal with two product lines: 500 units of a part at 12 euro with a 5 percent discount, and a service contract of 250 euro per month for 12 cycles. The deal value becomes 5,700 plus 3,000, so 8,700 euro. Weighted, it counts as 3,480 euro.
After sixteen days in Proposal the deal is marked Stale, two days over. It shows up on the account manager's Today screen, and an automation creates a call for the next morning. The call leads to a new meeting and the deal moves to Negotiation.
In the weekly meeting the sales manager opens Totals per stage and filters on stalled deals. The conversation is about the nine deals that stalled, not all 84. After a quarter, a report on lost reasons shows most lost deals fail on delivery time, not on price. Nobody expected that, and nobody could see it while no reason was recorded.
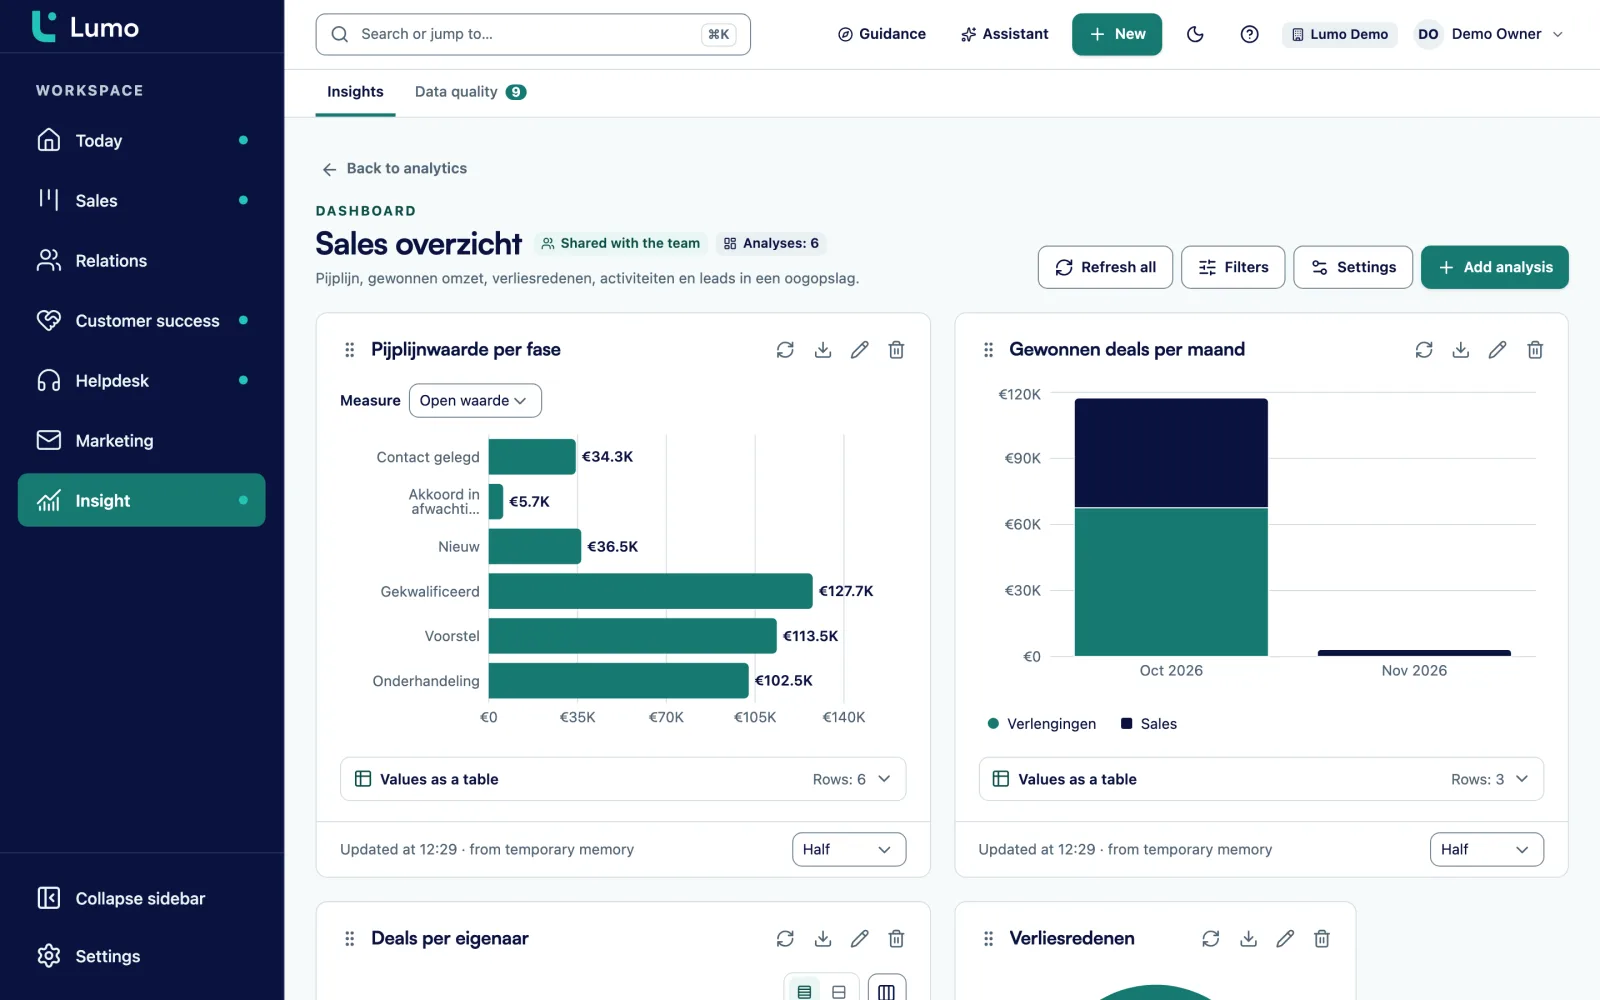
In reports you choose deals, pipelines, stages or lost reasons as the source. A funnel shows how many deals move from stage to stage. A waterfall shows how value changes. A goal line shows whether you are on track for the month or quarter. Click a bar and you see the deals behind it.
There is no separate forecast screen. You build a weighted forecast as a report that multiplies the deal value by the win probability per stage, optionally broken down by owner or expected close date. Put that report on a shared dashboard for the team.
What you should know: for recurring product lines, a report counts one period per line. The deal value itself does count the number of cycles. More on reports and dashboards and in the guide sales forecasting.
Deals often start as leads. A lead converts to a deal once, with the person and organization already linked. Mail with the customer lands on the deal through Gmail, and Google Calendar meetings become activities on the most recent open deal. With automations you react to a stage change, a won deal or a stalled one. And if you still need to design your stages, start with the guide set up a sales pipeline.
Lumo has no separate forecast screen. You build a weighted forecast as a report on the probability per stage and put it on a dashboard. The product lines view is not laid out for a small phone screen yet, so products on a deal are best handled on a laptop. The deal board itself works fine in your phone's browser.
Yes. Create as many pipelines as you need, each with its own stages. One pipeline is the default. A pipeline that has deals cannot be deleted.
Deal value times the win probability of the stage the deal is in. A 10,000 euro deal in a 40 percent stage counts as 4,000 euro.
A deal that has been in its stage longer than the Rots after (days) setting. It gets a label on the board and shows up on the owner's Today screen.
Yes. Per product line choose one-time, weekly, monthly, quarterly, semi-annually or annually, with an optional number of cycles. Without cycles, a recurring line counts as one year.
Yes. A lost deal needs a reason from your own list of lost reasons. That way you can report on why you lose.
Not as a separate screen. You build a weighted forecast as a report on the probability per stage. Reports
Yes. The import wizard brings over pipelines and stages, deals with product lines and billing, activities and notes. Switch from Pipedrive
Yes. Besides dragging, choose Move and pick the stage. Cmd or Ctrl plus K opens the command palette.
In the demo we put your stages on the deal board and show what weighted value and rotting say about your deals.