
Build your forecast report in Lumo
In a demo we build a weighted forecast per month with a goal line together, on sample data or your own stages. Or request a trial workspace.
A forecast is a reasoned expectation of what you will close in a period. It is only as good as your pipeline. This guide covers the methods, how to calculate a weighted forecast, how to check pipeline coverage and how to produce a number every week that you can act on.
A sales forecast answers one question: how much revenue are we likely to close this month or this quarter? It is not a target. A target is what you want. A forecast is what you expect, based on what is in the pipeline right now.
That sounds obvious, but in many teams the two blur together. A familiar pattern: in January leadership names a number for the quarter. The team arranges the pipeline so the number looks reachable. By mid February half of those deals have not moved for weeks, and in March people push hard on deals that are not ready to close. With discounts, and with a buyer who feels rushed.
A good forecast has three qualities. It is repeatable: someone else gets the same number from the same data. It is explainable: you can say per deal why it counts. And it is updated every week, not once a quarter.
The base is always the pipeline. Every deal has a value, a stage and an expected close date. Without those three fields you cannot forecast, only voice a feeling. That is why this guide starts with data hygiene, not formulas. Then come the methods, a worked example, pipeline coverage and a weekly routine.
Remember that a forecast is a range, not an exact number. The most useful conversation is about the gap between what is certain and what is possible, and which deals decide that gap. A sales manager who says "we will land between 80 and 95, and deals B and E decide where" has more to work with than someone who says "92".
A forecast is not a verdict on reps either. A number below target is information. It tells you to act now, with more leads, help on a big deal or an honest conversation about the target. The earlier you know, the more you can do.
Check these before you forecast. If one fails, the number means little.
Most teams combine two. They complement each other.
Multiply each deal value by the win probability of its stage and add it all up. Fast and objective. Weak when win probabilities are off or a few large deals dominate the total.
The owner puts each deal in a category: commit, best case or pipeline. You add up per category. Strong because the rep knows the deal. Weak because optimism counts too.
Look at what you closed in the same period last year or in recent quarters, and how much pipeline it took. Good as a check on the other two. Weak in a new market or with a new product.
Five made up open deals with a close date this quarter. The win probabilities come from the example pipeline in B2B pipeline stages.
| Topic | Value, stage and win probability | Weighted value |
|---|---|---|
| Deal A | € 40,000, Quote sent, 60% | € 24,000 |
| Deal B | € 25,000, Negotiation, 80% | € 20,000 |
| Deal C | € 60,000, Demo or proposal discussed, 40% | € 24,000 |
| Deal D | € 15,000, Needs confirmed, 25% | € 3,750 |
| Deal E | € 30,000, Negotiation, 80% | € 24,000 |
| Total | € 170,000 open value | € 95,750 weighted |
All amounts are examples. With real data you usually have more deals, which makes the weighted total more stable.
The weighted forecast in this example is € 95,750. But look at what is behind it. Deal C contributes € 24,000 while it is only in the demo stage with two stages to go. If that deal slips a quarter, the forecast drops by a quarter. That is the weakness of a weighted pipeline with few deals: one large deal can decide the total.
So you put the categories next to it. Owners place their deals in three groups:
Now you have a range. The floor is € 55,000, the weighted number € 95,750, and commit plus best case € 95,000. In this example the last two are close. That is a good sign: the win probabilities and the reps' judgement say roughly the same thing.
Then add the historical run rate. Suppose the team closed € 70,000, € 85,000, € 90,000 and € 78,000 in the last four quarters. An average of € 80,750. A forecast of € 95,750 is higher than usual. Is that possible? Yes, if something changed, such as more leads or a new product. If nothing changed, the win probabilities are probably too optimistic.
So the number you send to leadership in this example is not 95,750 but a range with an explanation: "between 55 and 95, expected around 85, and deal A matters most". That is a number you can defend.
A forecast says what you expect to close. Pipeline coverage says whether there is enough in the pipeline to reach your target at all. You calculate it as open deal value with a close date in the period, divided by the target.
A made up example. The target for the quarter is € 100,000. Open pipeline with a close date this quarter is € 170,000. Coverage is 1.7.
Is that enough? It depends on your own win rate by value. Suppose you historically win 45 percent of open deal value in a quarter. Then you need coverage of 1 divided by 0.45, roughly 2.2. At 1.7 you are below that. The expected outcome is 170,000 times 0.45, so € 76,500.
You see that gap at the start of the quarter, not at the end. Then you can still act: follow up more leads, pull deals forward from next quarter where that is realistic, or adjust the target. Calculate coverage per month and per rep, so you also see who needs help.
There is no fixed rule for the right coverage. You set it from your own numbers. The guide on sales KPIs explains how to measure win rate and cycle time.
Fifteen to thirty minutes a week, on a fixed day. It works best straight after the weekly pipeline review.
Each rep goes through their open deals with a close date in the period. Is the stage right, the date, the value? Deals with a date in the past get a new date or are marked lost.
Each rep places their deals for this period in commit, best case or pipeline. For every commit deal, ask: what did the buyer say that makes you think so?
A report with weighted value per close month and per rep, with the target as a line. Put the sum of commit and best case deals next to it.
Where does the weighted forecast differ from the categories? Which deal makes the difference? What does it take to close that deal, and who does it?
Write down the range and the expected number, with a date. After the period, compare with what actually closed. That shows whether your forecast is improving.
A forecast only becomes reliable when you compare it afterwards with what actually happened. Do that every period, and keep it simple.
A made up example. In week 1 of the quarter the expectation was € 95,750. At the end, € 82,000 was closed. The deviation is 95,750 minus 82,000, divided by 82,000. That is about 17 percent too high.
Then look at where the gap came from:
Track it per quarter in a simple list: expectation in week 1, week 5 and week 9, and the outcome. After three or four quarters you see whether you are consistently too high or too low. Then adjust win probabilities per stage, or tighten the exit criteria.
If you sell subscriptions, retainers or service contracts, you need two numbers and you should not mix them up.
Contract value. What the deal is worth over an agreed period, for example a year. This is usually the deal value in your pipeline and the number you compare reps on.
Revenue in the period. What actually comes in from that deal this quarter. An annual contract of € 12,000 that starts in mid February brings in roughly € 1,500 in the first quarter.
A made up example. A team signs three subscriptions of € 1,000 a month each in March. Contract value is € 36,000 per year. Revenue in the first quarter is zero, because the subscriptions start in April.
So agree which number your forecast is, and label it in the report. For the sales meeting, contract value is usually the most useful. For finance, revenue in the period is what counts. Two reports side by side are better than one number that means something different to everyone.
If the team knows the forecast has to equal the target, it will. Keep the two separate and discuss the gap.
A close date that moves a month every month makes every forecast too high. Agree that a deal pushed twice goes back a stage or gets a conversation with the manager.
Template win probabilities are a start. Adjust them to your own numbers after six months. Otherwise you calculate with numbers that are not about your team.
With few deals, one large deal decides the total. Look at the five largest deals separately in every forecast and discuss them one by one.
If one rep enters an annual contract as one month and another as three years, no forecast adds up. Agree on one deal value rule. See how to set up a sales pipeline.
A total that adds up can hide one rep far above target and two far below. Look per rep and per pipeline as well.
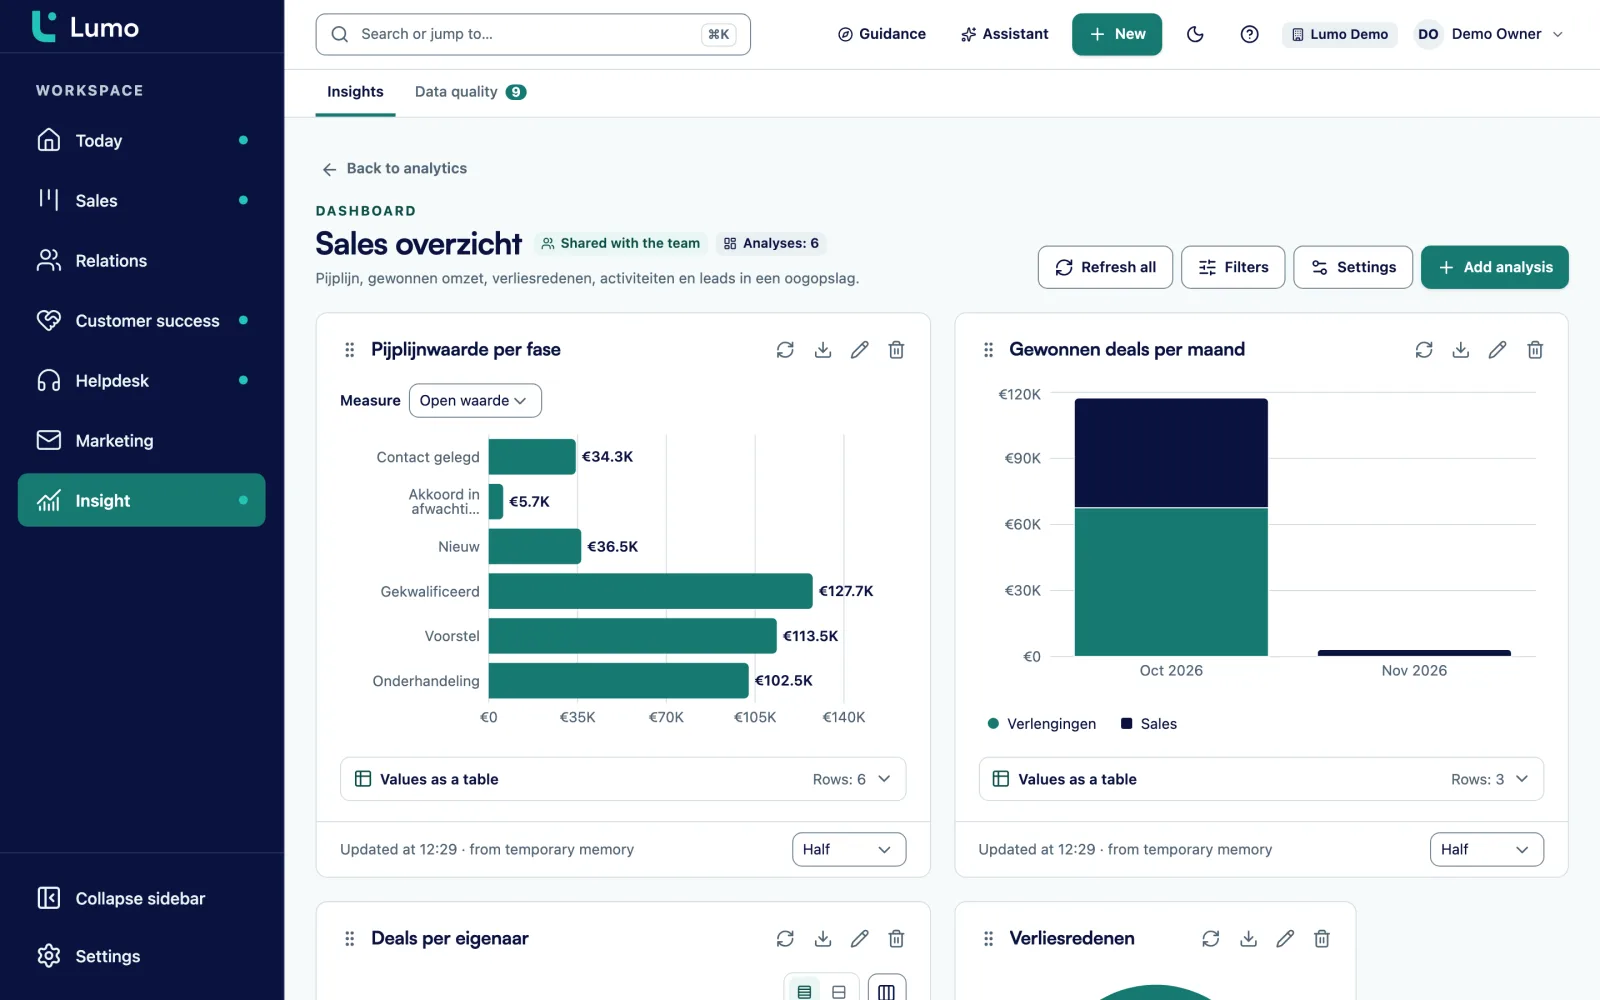
Lumo has no dedicated forecast screen. You build a weighted forecast as a report. In the report builder you choose deals as the source, the sum of deal value times stage win probability as the measure, and expected close month or owner as the breakdown. A goal line shows where you stand against target, and from every bar you drill into the deals behind it.
The deal board already shows the number of deals, value and weighted value per stage. Stalled deals get a warning, so in step 1 of the routine you quickly see what needs cleaning up. Put the report on a dashboard you share with the team. Read more about reports and dashboards, pipeline management or the page for sales managers.
There is no dedicated forecast screen and no category field for commit or best case. To use categories, add a custom select field on the deal and break your report down by it. In reports a recurring product line counts for one period, while deal value on the board counts a year. Agree which of the two is your forecast. Reports see all deals in the workspace.
First make sure every open deal has a value, a stage and an expected close date. Then calculate the weighted pipeline, add the reps' categories and check against your historical run rate. Repeat every week.
The sum of each open deal's value times the win probability of its stage. A € 40,000 deal in a stage with 60 percent win probability counts for € 24,000.
A target is what you want to reach. A forecast is what you expect to reach based on the pipeline. The gap between them is the conversation you need to have.
Every week on a fixed day, ideally right after the pipeline review. A forecast made once a quarter comes too late to act on.
Open deal value with a close date in the period, divided by the target. Whether it is enough depends on your own win rate. At a 45 percent win rate you need about 2.2 times your target.
It depends on your data and the number of deals. Measure it yourself by comparing expectation and outcome each period. After a few quarters you see whether you are consistently high or low.
Start with values like 10, 25, 40, 60 and 80 percent. After six months, adjust them to how many deals that reached a stage were eventually won. The pipeline stages guide shows how.
Yes. A report that sums deal value times win probability per close month gives you a weighted forecast. For categories, add a custom select field on the deal.
In a demo we build a weighted forecast per month with a goal line together, on sample data or your own stages. Or request a trial workspace.