
See customer success on one screen
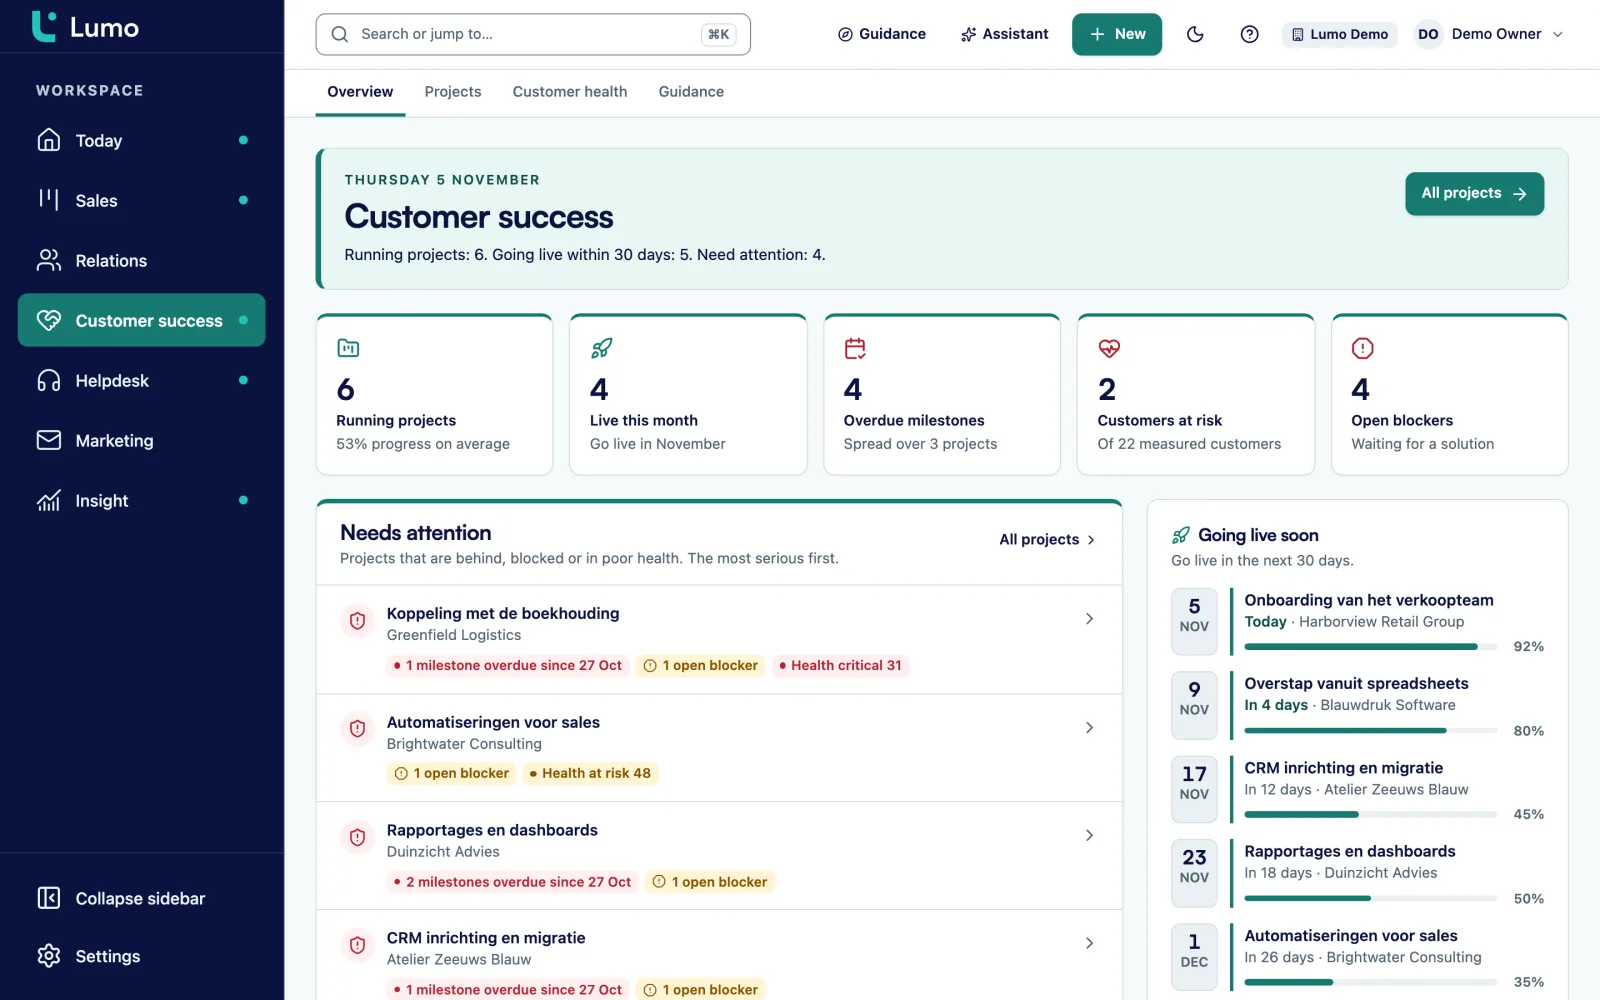
In the demo we show the customer success overview on sample data: health per account, projects per phase and blockers. And we look together at which metrics fit your team.
Many teams measure customer success with one NPS survey a year. That is too late and too coarse. This guide gives you the formulas for retention, churn and expansion, a health score you can build yourself, and what to do for each colour.
Sales has a clear end point. The deal is won or lost. Customer success does not. An account can look happy for two years and then cancel in a single call. Or it stays, never buys anything extra and uses half of what it pays for. On a revenue sheet you only notice when it is too late.
So you need two kinds of numbers.
Outcome metrics tell you what happened. How much revenue you kept, how many customers left, how much they expanded. These numbers are hard and leadership asks for them. But you only see them afterwards, usually per quarter or per year.
Signal metrics tell you what is likely to happen. How fast an account goes live, how often it opens a ticket, how satisfied it is with the handling, whether its team actually uses the product. These numbers are softer. But you can still do something about them.
A common mistake: a team only picks outcome metrics because leadership asks for them. Then every quarter you discuss accounts that are already gone. The opposite happens too. A team only tracks signals, such as satisfaction and usage, and loses touch with revenue. A good set has a few of each. Six to eight numbers in total is enough.
A second point: measure per account, not only per team. An average satisfaction of 8 says nothing about that one large account scoring 4. In B2B, revenue often depends on a handful of accounts. You want to know those by name, with their numbers next to them.
A third point: agree on definitions before you calculate. Does a customer moving from an annual to a monthly contract count as churn? Does a price increase count as expansion? Does time to value start at signature or at kickoff? Without an agreement you get the same discussion every quarter, and two teams with two different retention figures.
All numbers in the examples below are made up. They show the math, they are not benchmarks. What good retention or satisfaction looks like depends on your market, contract model and customer size. Compare yourself mostly with your own previous quarter.
Ten metrics. The first five are outcomes, the last five are signals. Pick no more than eight.
Recurring revenue at the start of the period, minus revenue lost to cancellations and downgrades, divided by the starting revenue. Expansion does not count. So GRR can never go above 100 percent. It shows how leaky your bucket is.
The same sum, but you add expansion from existing customers. Starting revenue plus expansion minus downgrades minus cancellations, divided by starting revenue. New customers from the period do not count. NRR can exceed 100 percent when existing customers expand more than you lose.
The number of customers who left in the period, divided by the number at the start. Example: 6 lost out of 120 is 5 percent. This metric weighs every customer the same. That is why it belongs next to revenue churn.
Recurring revenue lost to cancellations and downgrades, divided by starting revenue. It equals 100 percent minus GRR. If mostly small customers leave, logo churn is high and revenue churn is low. That calls for a different approach than the reverse.
Extra recurring revenue from existing customers in the period: more users, an extra module, a price increase if you agree to count it. Track it as an amount and as a percentage of starting revenue. Decide whether price indexation counts.
Days from signature to the moment the customer gets its first real value. You define that moment yourself, and concretely: first invoice sent, first campaign live, the team working in the system for a full week. Use the median, since one outlier skews the average.
The share of customers that finish onboarding within the agreed time. Or per account: completed milestones divided by the total. An account at three of seven milestones after eight weeks is a signal, even if it has not complained yet.
Customer satisfaction. After a contact moment, usually a solved ticket, you ask how satisfied the customer was. The score is the number of positive answers divided by all answers. CSAT tells you about that one moment, not about the relationship.
Net Promoter Score. You ask how likely someone is to recommend you, on a scale of 0 to 10. Nines and tens are promoters, zero to six are detractors. NPS is the percentage of promoters minus the percentage of detractors, so a number between minus 100 and 100.
How much of what the customer pays for is actually used. For example active users divided by paid users, or modules in use divided by modules purchased. Decide per product what active means.
Say a software company starts the quarter with 80 customers and $100,000 in monthly recurring revenue. Every number here is made up to show the math.
During the quarter:
GRR is starting revenue minus cancellations minus downgrades, divided by starting revenue. That is 100,000 minus 6,000 minus 2,000, which is 92,000, divided by 100,000. GRR is 92 percent.
NRR adds the expansion. 92,000 plus 11,000 is 103,000, divided by 100,000. NRR is 103 percent.
Logo churn is 4 divided by 80, so 5 percent. Revenue churn is 8,000 divided by 100,000, so 8 percent.
The new customers from sales do not count in any of these numbers. That is on purpose. You want to know how well you keep and grow the customers you already have. Count new revenue and a strong sales quarter hides a leak in customer success.
What does this tell you? An NRR above 100 percent looks fine. But a GRR of 92 percent says eight percent walks out every quarter, and expansion only just makes up for it. If expansion is weak for one quarter, your existing revenue shrinks. So the question for the next review is not how to sell more. It is why those four customers left and whether the three downgrades form a pattern.
Two things to agree upfront. Whether you calculate per month, per quarter or per year, and stick to it. And use a cohort: the customers who were already customers at the start of the period. Someone who joined halfway and left again does not belong in this number. That account tells you something about onboarding.
Outcome metrics tell the story afterwards. Signal metrics give you time. Four of them are the most useful in B2B.
The first weeks matter a lot. A customer who sees value quickly builds the product into its work. A customer still configuring after three months starts to doubt at the first invoice. So track, per account, the go-live date against the planned date and the number of completed milestones. A two-week delay is not a problem yet. A delay without a next step is.
Many tickets do not automatically mean an unhappy customer. A customer asking questions is using the product. Watch the change. An account that went from two tickets a month to eight has something going on. An account that used to ask questions and has gone quiet might too. Tickets that stay open long or breach their SLA are a stronger signal than the count. The guide on setting up a helpdesk shows how to make that handling measurable.
You ask CSAT shortly after a contact moment. It tells you whether that ticket went well. You ask NPS apart from any moment, for example twice a year. It says something about the relationship. Do not mix them up. And read the answers, not only the number. A 6 with the comment "your support is good but the product lacks reports" is an expansion opportunity or a churn risk, depending on what you do with it.
Be careful with NPS on small numbers. With twenty answers, one person moves the score by five points. Then do not compare quarters. Read the answers per account instead. And watch who answers. If only your main contact gets the question, you learn nothing about the users.
If a customer pays for 25 users and 11 are active, chances are it downgrades at renewal. Or worse, the decision maker never sees the product work. Track adoption per account and per module. Also read how to increase adoption, which has a week by week plan.
A health score sums up the signals per account in one number from 0 to 100. The goal is not a perfect prediction. The goal is that every week you know which customers to call. Below is a template you can copy and adjust. The weights are a starting point, not the truth.
Recalculate the score daily or weekly, but review it weekly. Every quarter, check whether the score was right. Take the customers who cancelled in the past year and look at their score three months before. If they were green, you are measuring the wrong things or one signal weighs too much.
Say an account pays for 20 users and 13 are active, which is 65 percent: 15 points. The project is live and on schedule: 20 points. There was one SLA breach last month: 10 points. CSAT positive, no NPS answer: 15 points. The sponsor left three months ago: 0 points. Total 60, amber. Notice that satisfaction is not what pulls the score down. Adoption and the relationship are. So the conversation is about who the new sponsor is and why seven people do not log in. This example is made up.
A score without an agreed action is decoration. Agree for each colour what happens, who does it and when.
A fixed touchpoint per quarter with the sponsor. Ask about plans for the next six months and look for modules the customer does not use yet. Ask for a reference or a review when the relationship is good. Put an expansion opportunity in the pipeline as a deal, so sales can pick it up.
A conversation within two weeks. Check beforehand which signal pulls the score down. If it is adoption, plan training or a session with the users. If it is tickets, bring in the service lead. If it is the relationship, find a new sponsor. Record a next step with a date.
A conversation within a week, with the manager or the relationship owner present. Write a recovery plan with three to five actions, an owner per action and a date. Review it weekly until the account is back to amber. Also check the renewal date: how much time is left.
Every cancellation gets a conversation about why, and a reason from a fixed list. Check what the health score was three and six months earlier. That way the score gets better every quarter, and you see whether a pattern belongs to a customer type or a module.
Metrics only work once they have a fixed place in the week. This rhythm works for most B2B teams.
Ten minutes. Which accounts turned red, which tickets are close to their SLA, which go-live dates are this week. No discussion, just who picks up what.
Half an hour with the team. For each amber or red account: what is the cause, what is the next step, who owns it. Accounts that sat on amber for two weeks without progress go to the manager.
Walk through the running onboardings. Which projects are behind, which blockers are open, which customers went live. Review adoption per account and plan training where it is low.
Calculate GRR, NRR, logo churn and expansion. Discuss every cancellation. Test the health score against what happened and adjust the weights if needed. Pick one metric for the team to focus on next quarter.
Ninety days before the renewal date, look at the score, usage and open issues. That leaves time to fix something. A renewal you only look at a week ahead is a gamble.
Counting new revenue in retention. Once revenue from new customers ends up in NRR, the number says nothing about customer success anymore. Keep the cohorts strictly apart.
One NPS a year as the main metric. One measurement a year is too slow to steer on, and the score depends a lot on who happened to answer that week. Use NPS as a signal per account, not as a team target.
A health score nobody understands. A model with fifteen signals and decimal weights feels precise. But if a CSM cannot say in one sentence why an account is amber, nobody acts on it. Start with five signals.
A score without a playbook. Red without an agreed action means everyone looks at the same list and nobody calls. Tie each colour to an action with a deadline and an owner.
Averages across all customers. An NRR of 103 percent can be three large accounts that expanded a lot and twenty small ones that downgraded. Split your numbers by segment, for example by customer size or by product.
Reading ticket volume as unhappiness. An account without tickets can be very happy or no longer using the product. Watch the change and the handling, not only the count.
Definitions that shift per quarter. If a downgrade counts as churn this quarter and not last quarter, you compare apples with oranges. Write the definitions down and only change them with a note.
In Lumo the Customer success overview fits on one screen: accounts that need attention, projects going live soon, health per customer, projects per phase and open blockers. A delivery project has a phase, progress, a go-live date, milestones, a next step, internal notes, files, and the blockers and tickets that belong to it.
Every organization gets a health score from 0 to 100. It is based on ticket signals over the last 90 days and stored as a daily snapshot, so you can see how an account moves. After a ticket is solved, a CSAT question goes out through a signed link. How the tickets themselves are handled is on the helpdesk page.
The rest of this template, such as adoption, relationship and NRR, you calculate yourself and record in fields or reports. The page for customer success teams shows how a CSM runs the week in Lumo, and reports covers what the report builder can do.
The health score in Lumo looks at ticket signals. Adoption, sponsor and revenue are not part of it. If you want the full model from this guide, put those signals in custom fields on the organization and review them next to the score. Reports that combine tickets with deals are on the roadmap. For now you calculate NRR and GRR on deal value in the report builder or outside it.
GRR only counts what you lose to cancellations and downgrades, and never goes above 100 percent. NRR also counts expansion from existing customers, so it can exceed 100 percent. Always look at both: a high NRR can hide a leak in GRR.
Logo churn is the number of customers who left divided by the number at the start of the period. Revenue churn is recurring revenue lost to cancellations and downgrades divided by starting revenue. Track both, since they tell different stories.
It depends on your market, contract model and customer size. An outside number says little about your situation. Compare your NRR with your own previous quarters and check that GRR stays stable.
A number per account, often from 0 to 100, that sums up signals such as usage, tickets, satisfaction and the relationship. The point is to know which accounts need attention. It only works when every colour comes with an agreed action.
Start with five. More signals do not make the score better, only harder to explain. Add one only when a quarterly review shows a signal was missing for customers who left.
CSAT measures satisfaction with one contact moment, such as a solved ticket. NPS measures how likely someone is to recommend you and says more about the relationship. Ask CSAT right after the moment and NPS separately, for example twice a year.
Pick a concrete first value moment per product, for example the first week the team works in the system. Count the days from signature to that moment and use the median across customers.
That is a choice. Many teams keep indexation separate because it says nothing about how well customer success works. Agree on it, write it down and stick to it, so quarters stay comparable.
Amber and red accounts every week, the model itself every quarter. In the quarterly review, check what score departed customers had three months earlier. That tells you whether the score works.
In the demo we show the customer success overview on sample data: health per account, projects per phase and blockers. And we look together at which metrics fit your team.