
Bring your pipeline review to the demo
Bring your stages and a few real deals. We will show what your review and your forecast look like in Lumo.
You see what sits in each stage, how long deals have been there and what the weighted value is. Reports drill down to the deal. And data quality rules make sure your team fills in the fields your numbers depend on.

Every Monday at nine, the same round. Everyone talks through their deals. One rep is optimistic, another careful. A deal that has been in negotiation for six weeks is still almost closed. And you write down on a notepad what you think will come in this month.
The problem is not the team. The problem is that the CRM does not tell you enough to base the conversation on. The close date has moved three times without anyone noticing. One rep enters deal value including VAT, another enters a monthly amount. A lost deal has no reason, so at the end of the quarter you do not know why you lose. And whether anyone talked to the customer in the past two weeks, you only find out by asking.
So the Monday meeting turns into an interrogation, and nobody enjoys that. Reps update the CRM on Sunday evening. You retype numbers into a spreadsheet for the leadership team. Everyone is busy reporting instead of selling.
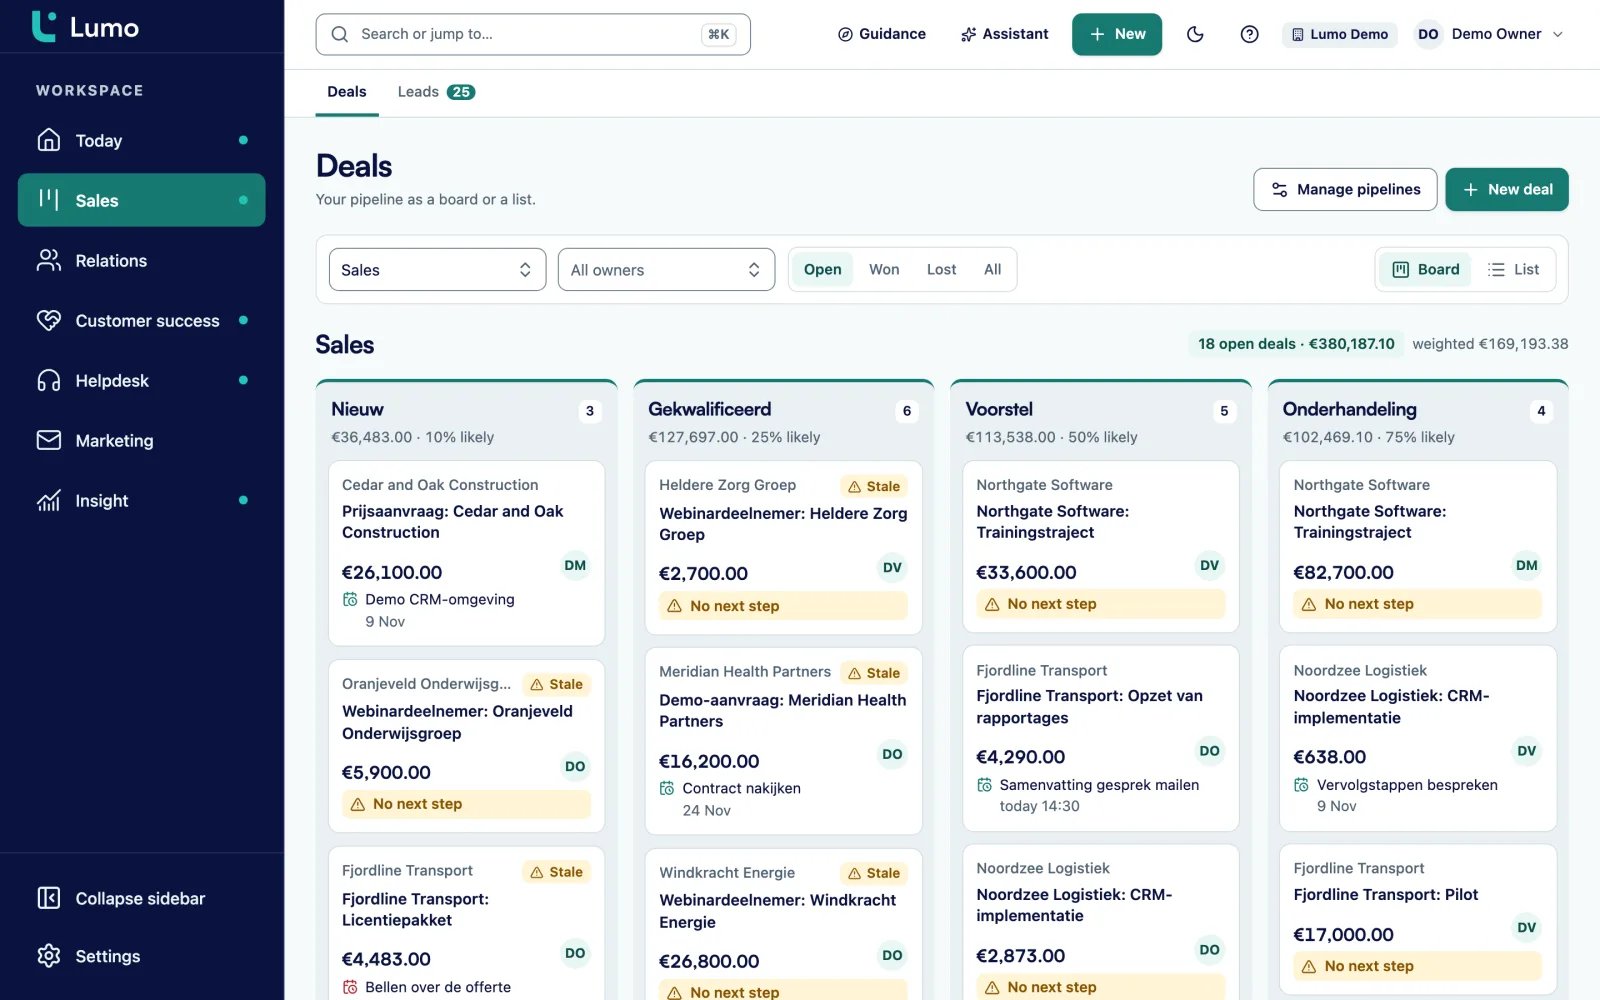
In Lumo your review starts on the deal board. For each stage you see the number of deals, the value and the Weighted value, which is the value multiplied by the stage win probability. Deals that sit in a stage longer than you set get a warning with the number of days too long. Open a deal and you see every stage change with its date and duration, and whether there is a next step.
That changes the conversation. You stop asking how a deal is going. You ask why this deal has been in proposal for 18 days when you agreed on 10, and what the next step is. That is coaching instead of checking.
Read more about pipeline management or the guide on building a reliable sales forecast.
The rhythm we see in teams that do this well, with the screens used at each point.
You open your team dashboard in Insights: won value this month against target, new deals per rep and calls last week. A bar that looks off, you click through to the deals behind it.
On the deal board you walk the stages from right to left. You start with the deals flagged days too long. The Totals per stage table shows how much weighted value sits in each stage.
With each rep you open the deal list filtered by owner. You go through deals with no next step and deals whose expected close date has passed. You save that filter as a view, so it is ready next week.
Under Guidance you open Violations. It lists deals where a rule raised a warning, for example a deal in proposal without products. You see per rep where it goes wrong and talk about it.
You open a report that multiplies deal value by stage win probability, broken down by month of the expected close date. That is your weighted forecast. You add a goal line.
If deals keep stalling in one stage, you set up an automation that creates a task for the owner once a deal sits still too long. Dry run first, then live.
The deal board shows the total value and weighted value for each stage. Weighted value uses the win probability you set per stage. A discovery stage at 10 percent and a negotiation stage at 70 percent give a more realistic picture than the plain total.
Every stage also has a Rots after (days) limit. When a deal sits still longer, you see it on the board straight away, with a line like 18 days in this stage, 8 days too long. The rep sees the same deal at the top of Stuck deals on their Today screen. So you both look at the same list.
A lost deal needs a reason. You manage those reasons yourself under Lost reasons in the settings. At the end of the quarter you report on them, so you know whether you lose on price, timing or a competitor. Several pipelines side by side are fine, for example one for new business and one for expansion.
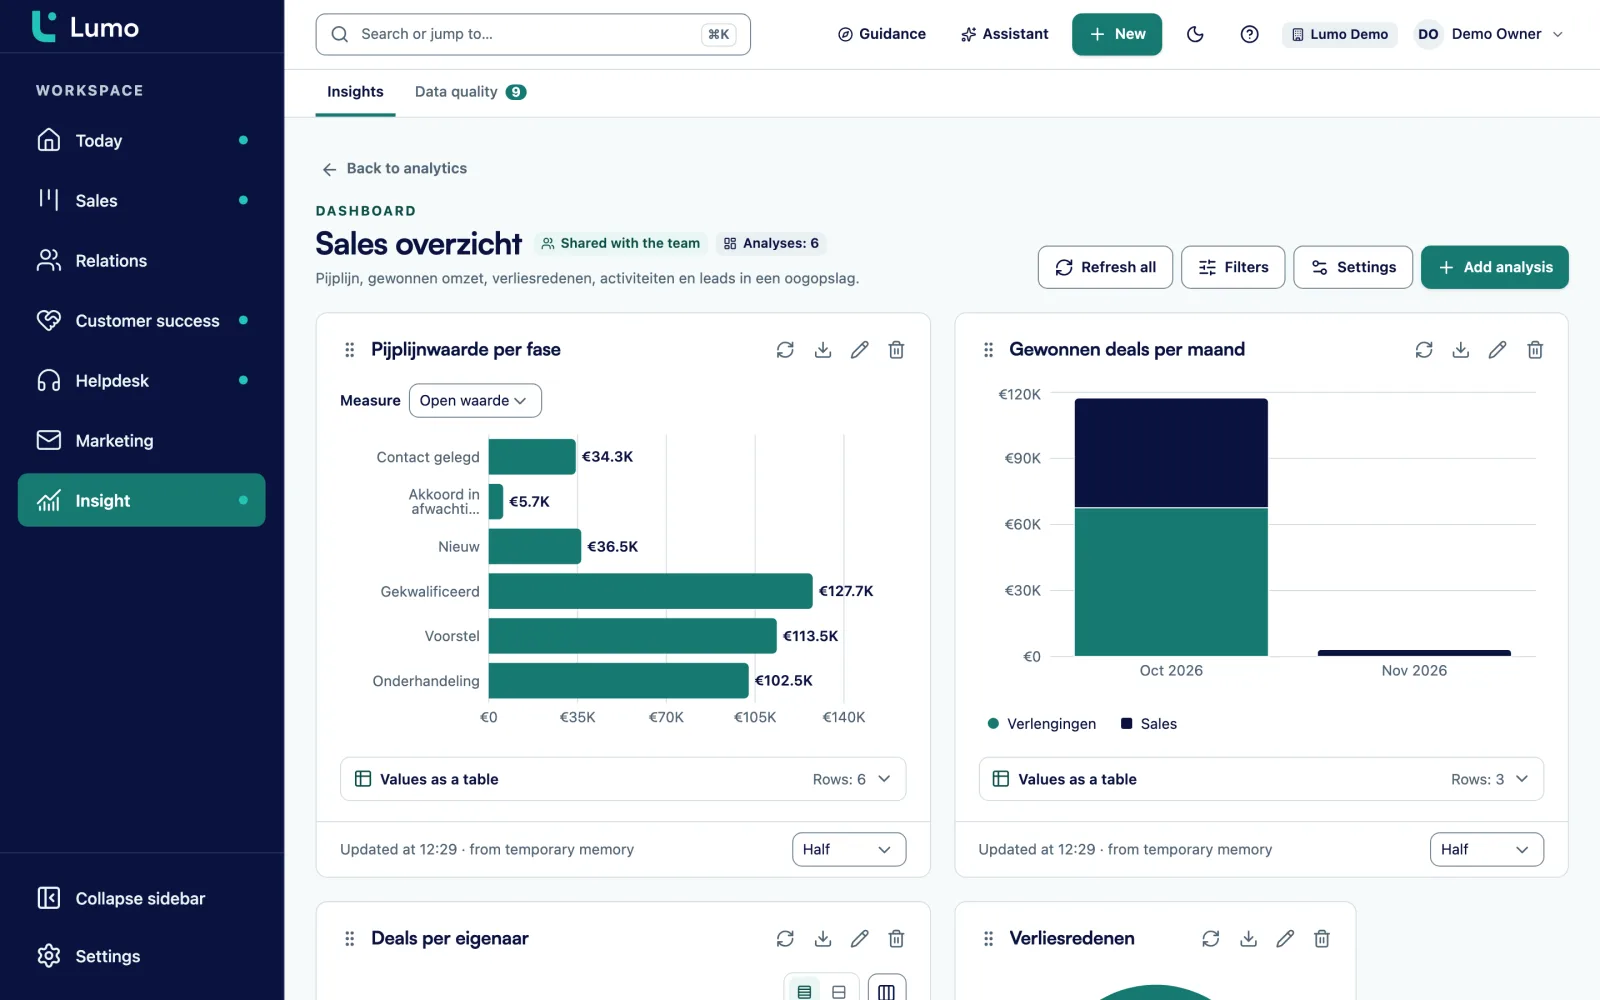
In Build an insight you pick a source, a measure and a breakdown. Sources include deals, activities, leads, pipelines, stages, lost reasons and team members. A measure can be a count, a sum or a ratio, such as the share of deals won. You see the result live while you build.
Chart types are KPI, ranked bars, donut, funnel, waterfall, stacked bars, line, area and table. Periods come from presets, including fiscal year, or a custom range. A goal line shows how far along you are. Click a bar and you see the deals behind it. CSV export is there too.
Reports go onto dashboards with filters. A dashboard is private or shared with the team. If you want something quickly, you can describe a report in a sentence and the AI builds it. More on the reports and dashboards page.
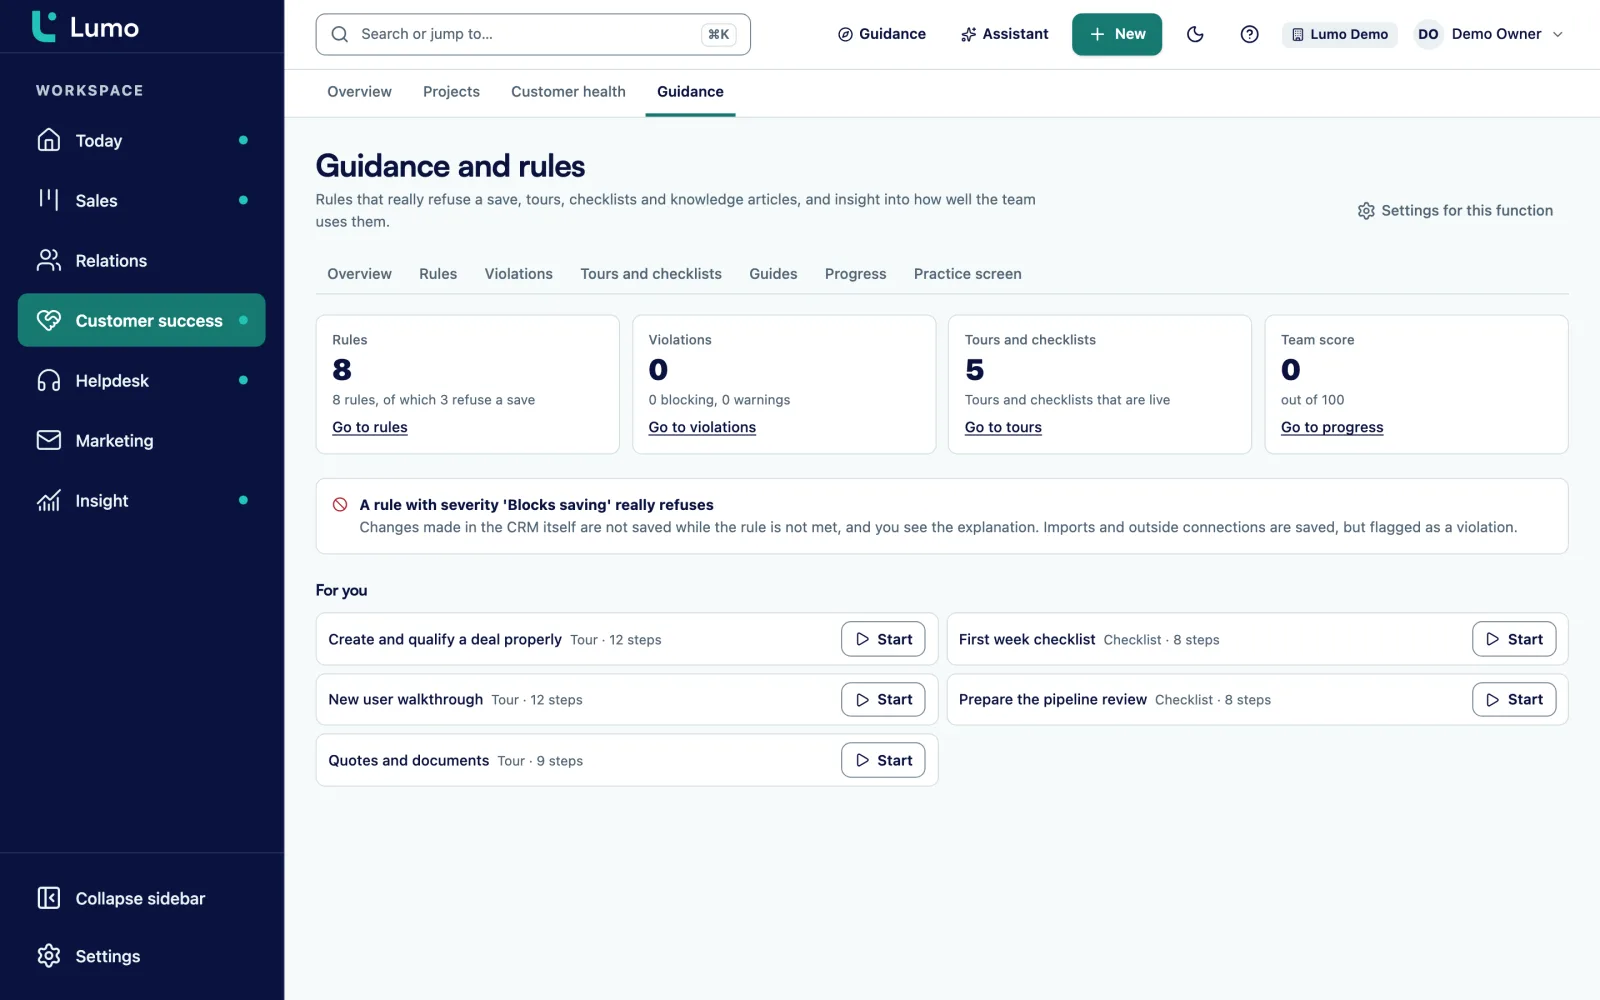
A report is only as good as the data under it. So under Guidance you set data quality rules. Each rule has a severity: Tip, Warning or Blocks saving. A tip only explains. A warning lets the save through but adds a line to the Violations list. Blocking refuses the save until the rule is met, with your explanation shown.
There are 8 default rules for deals you can install in one click and then adjust. Blocking applies to what someone does on screen or through the API. Imports, forms, chat and email are saved anyway, with a flag.
You also build walkthroughs and checklists for new reps, and guides that explain how your team works. The adoption score shows how far someone is: 70 percent completed walkthroughs and 30 percent ticked checklist items. Read more about CRM adoption and guidance.
A sales manager works from a short list. Pipeline coverage: how much weighted value is open against this quarter's target. Conversion per stage: how many deals move from discovery to proposal, and from proposal to signed. Cycle time: how long a deal sits in each stage on average. Win rate and lost reasons. And activity per rep: calls, meetings and new deals.
In Lumo these come from ordinary actions. Weighted value is on the board. Cycle time comes from stage history, because every stage change is kept with its duration. Conversion shows in a funnel report on the stages source. Lost reasons are a source of their own in reports. Activities you count per owner and per type.
Two things make those numbers reliable. Products on the deal, so deal value is calculated the same way everywhere. And an expected close date that reps update when it moves. How to pick a KPI set that steers rather than just measures is covered in the guide on sales KPIs.
Every stage gets a win probability and a stall limit. The board uses them to calculate weighted value.
Set a target on a KPI or chart and see the share of the goal you have reached.
Deal stuck too long? Create an activity for the owner. Dry run first, then live. Automations
Custom fields can be required on deals, leads and contacts, with field types like monetary, date and select.
Owner, admin, member and viewer. A viewer reads along without changing anything, handy for a board member.
A team dashboard next to your private one, with filters per pipeline or owner.
A list of deals with no next step or past their close date, ready for every one to one.
Type the report you want and the AI builds it. You adjust it afterwards. The AI assistant
Picture a software company with one sales manager, five account executives for new business and two for expansion. This is an example, not a customer. The manager reports to leadership every month on what is coming in.
Before, everything sat in one pipeline. Expansion and new business were mixed, so conversion per stage meant nothing. Deal value was sometimes a monthly amount and sometimes a yearly one.
In Lumo the team gets two pipelines. Licences are products billed monthly with 12 cycles, so deal value is always the contract over one year. The demo given stage gets a 30 percent win probability and a 14 day limit. Proposal gets 60 percent and 10 days.
Three rules go in. A warning when a deal in proposal has no products. A block when a deal in negotiation has no expected close date. And a tip on the expected close date. An automation creates a task for the owner when a deal has not moved in 14 days.
The team dashboard holds four reports: won value per month with a goal line, a funnel per pipeline, lost reasons this quarter and calls per rep. Leadership gets an account with the viewer role and opens the dashboard themselves. After that the Monday meeting takes half an hour and covers the flagged deals.
What we go through with a sales manager in the first weeks.
There is no separate forecast screen. You build a weighted forecast as a report: deal value times stage win probability, broken down by expected close date. That works well when your stages and probabilities are right. For recurring products a report counts one period per line, while the deal value counts a year. If you report on contract value, use deal value as the measure. Reports that combine deals with tickets or campaigns are on the roadmap, and scheduled email reports are not available yet. Instead you share a dashboard with the team or give someone the viewer role.
Give every stage a win probability, make sure each deal has an expected close date and products, and sum the weighted value per month. In Lumo you do that with a report. Read the guide on sales forecasting.
Yes. Every stage change is stored with its duration. The board flags deals that pass the stage limit, with the number of days too long.
Yes. A data quality rule can block the save until a field is filled, or only warn. Custom fields can be required as well.
Yes. Everyone in the workspace sees all deals and contacts. There is no per-record visibility. Personal Gmail email is private by default though.
Yes, with the viewer role. A viewer reads everything but cannot change anything. A shared dashboard is the place to start.
Yes, to CSV, and every report lets you drill down to the underlying records.
A lost deal needs a reason from your own list. Lost reasons are a source in reports, so you count them per period, pipeline or rep.
Start small, make the Today screen the start of their day and use the CRM yourself in every review. More in the guide on increasing CRM adoption.
Bring your stages and a few real deals. We will show what your review and your forecast look like in Lumo.