
See your KPIs on your own pipeline
In the demo we build a few of these reports on sample data and show how drilling down to the deals works.
A sales dashboard with thirty charts shows a lot and changes little. This guide gives you ten sales KPIs with a fixed definition, a way to work targets back from your revenue goal and a rhythm that decides which report goes into which meeting.
A KPI only helps if you act on it. Revenue matters, but you cannot steer on it on a Monday morning. It is the result of ten other things that happened earlier. So a good sales KPI meets three tests.
You can influence it. The team can do something that moves the number. Lead response time can improve this week. Market growth cannot.
It is unambiguous. Everyone calculates it the same way. Does a deal reopened after three months count as new? Does cycle time start at the lead or at the deal? Does a deal count in the quarter it was created or the quarter it closed? Until that is written down, everyone talks about a different number.
It comes with an action. If win rate drops at the proposal stage, what do you do? If you do not know, the number belongs on a dashboard for later, not in your weekly meeting.
It also helps to separate leading and lagging numbers. Lagging numbers such as won revenue and win rate tell you how it went. Leading numbers such as new pipeline, pipeline coverage and response time tell you how it is going. A manager who only watches lagging numbers sees a bad quarter once it is over. A good set has both.
Every worked example in this guide uses made-up numbers to show the math. They are not norms or benchmarks. A good win rate or cycle length depends on your market, your deal size and your lead source. Your own history is the only comparison that counts.
Before you build a single chart, write a short definition for each KPI. Use the same eight lines every time. It feels like paperwork, but it saves you a monthly debate about which number is right.
Below are ten sales KPIs written out in this template. Copy them, adjust them to your own pipeline and pick eight at most for your standing dashboard.
Most teams get a revenue target and nothing else. Four steps turn it into what has to happen each month. The numbers are an example. Use your own history.
Say the new business target is $1,200,000 a year and your median deal size is $15,000. You need 80 won deals.
If you win 25 percent of deals that reach a decision, you need 80 divided by 0.25, which is 320 closed deals. If roughly one in ten deals stalls without a decision, you need to create about 356 deals. That is 30 a month.
If 40 percent of your qualified leads become a deal, you need about 890 leads a year, around 74 a month. Now marketing knows what it steers on, and you can see whether that is realistic.
The quarterly target is $300,000. At a 25 percent win rate you want about $1,200,000 of open pipeline with a close date in that quarter at its start. With four account managers that is about 7 to 8 new deals per person per month.
If the math does not match what the team can do, you have three levers: more leads, a higher win rate or a larger deal size. Pick one to work on. A target that only works if all three improve at once is a wish.
Reports get used when they belong to a fixed moment. Agree per meeting which reports are on the table, and keep the list short.
Weekly sales meeting, 30 minutes. Leading numbers and actual deals. New pipeline this week against the target, lead response time, deals that have sat in a stage longer than the maximum, and deals with a close date in the next two weeks. Every deal you discuss ends with a next step and a date.
Monthly, 60 minutes. Trends and conversion. Stage conversion, cycle length per stage, lost reason share and pipeline coverage for the rest of the quarter. This is where you look for the pattern behind the single deals of the past weeks. Last month’s forecast accuracy belongs here too.
Quarterly, half a day. Outcomes and targets. Win rate, median deal size, sales velocity, won revenue against target and forecast accuracy over the quarter. This is also where you work next quarter’s targets back again, and remove reports nobody opened.
Use the same dashboard in every meeting that the manager uses day to day. As soon as the team builds its own spreadsheet export, you have two versions of the truth and you end up debating numbers instead of deals.
Counting activities as a goal. Fifty calls a day is a means. Make it a target and you get fifty short calls. Use activities to understand why a number moves, not as a KPI by itself.
Reading a weighted forecast as a promise. The weighted value of a pipeline is deal value times the win probability of the stage. It is an average across many deals, not a prediction per deal. Use it next to the rep’s own judgement.
Lumping recurring revenue together. A deal worth $1,000 a month and a one-off deal of $12,000 count the same in one report and differently in another. Agree whether you count annual value, first period or contract value, and use it in every report.
Team averages. An average win rate of 30 percent can be one person at 50 and another at 10. Look per person, but discuss it one on one.
Data that cannot carry the number. A lost reason typed as free text, close dates that never get updated, deals marked won weeks late. Then you measure how well the team does admin, not how well it sells. Read how to keep CRM data clean before you tie targets to numbers.
Quietly changing the definition. If you change what counts halfway through the year, you compare apples with oranges. Record the change with a date and recalculate the past, or start a new series.
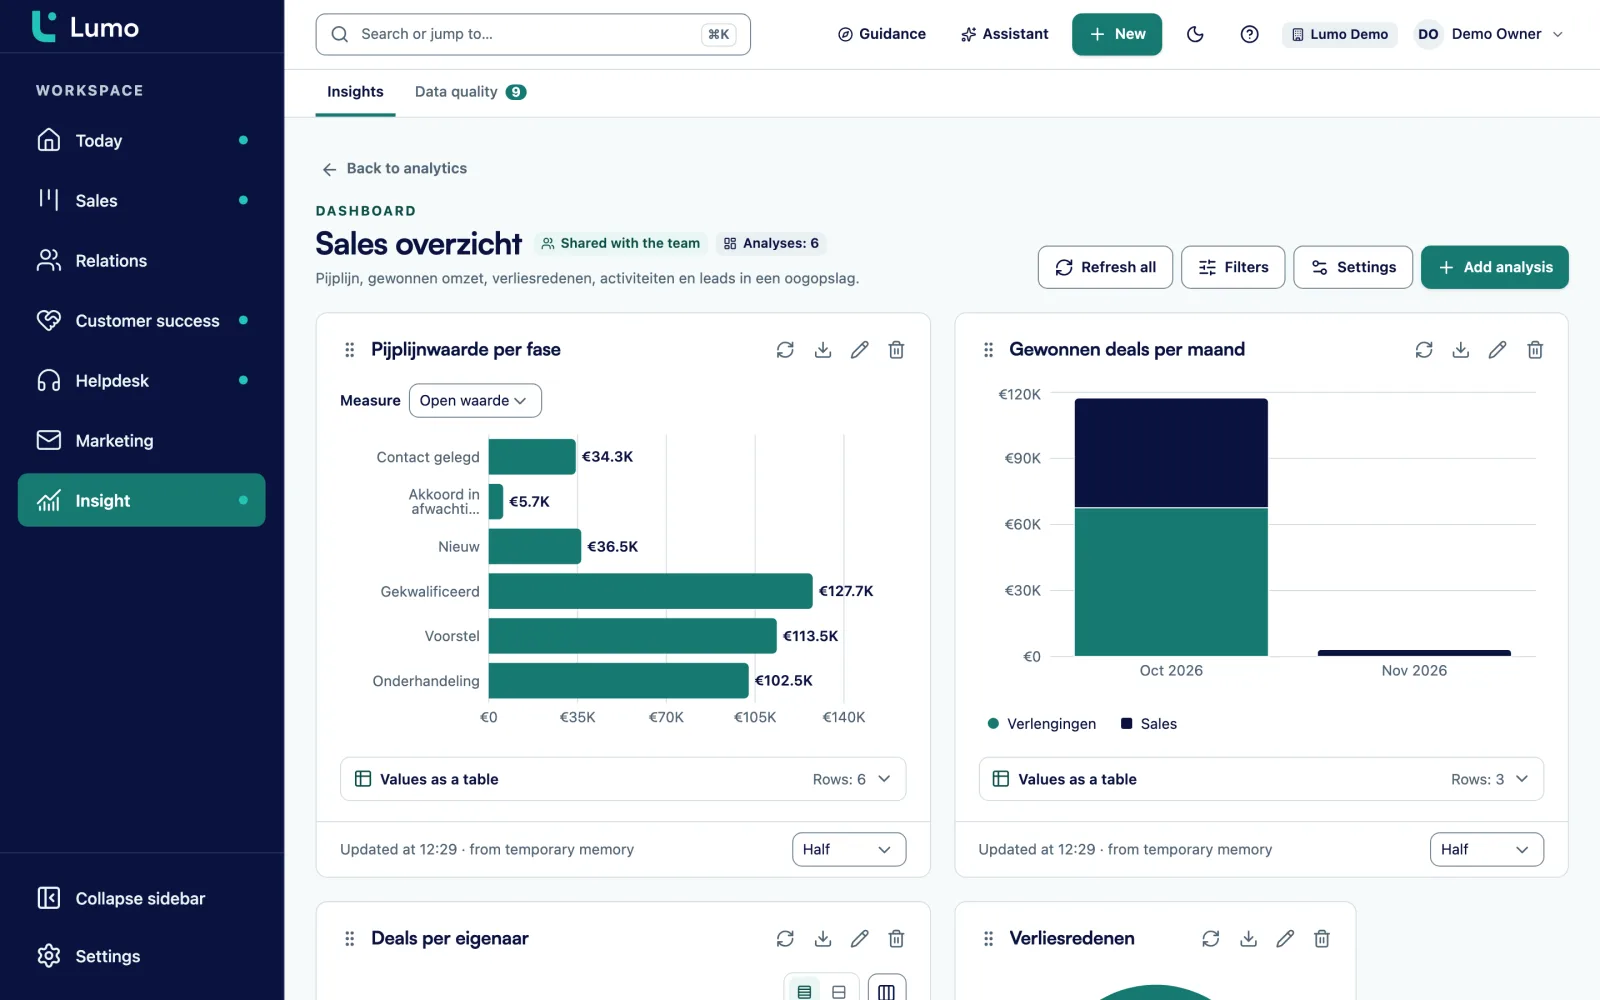
In the Lumo report builder you pick a source, a measure and a breakdown and see the result straight away. Measures can be ratios and percentages, so you build a win rate or stage conversion without a spreadsheet. There are nine chart types, including KPI, funnel and waterfall. Periods range from presets to fiscal year, rolling windows and custom dates. You add a goal line and drill down to the deals behind a number. Dashboards stay private or are shared with the team.
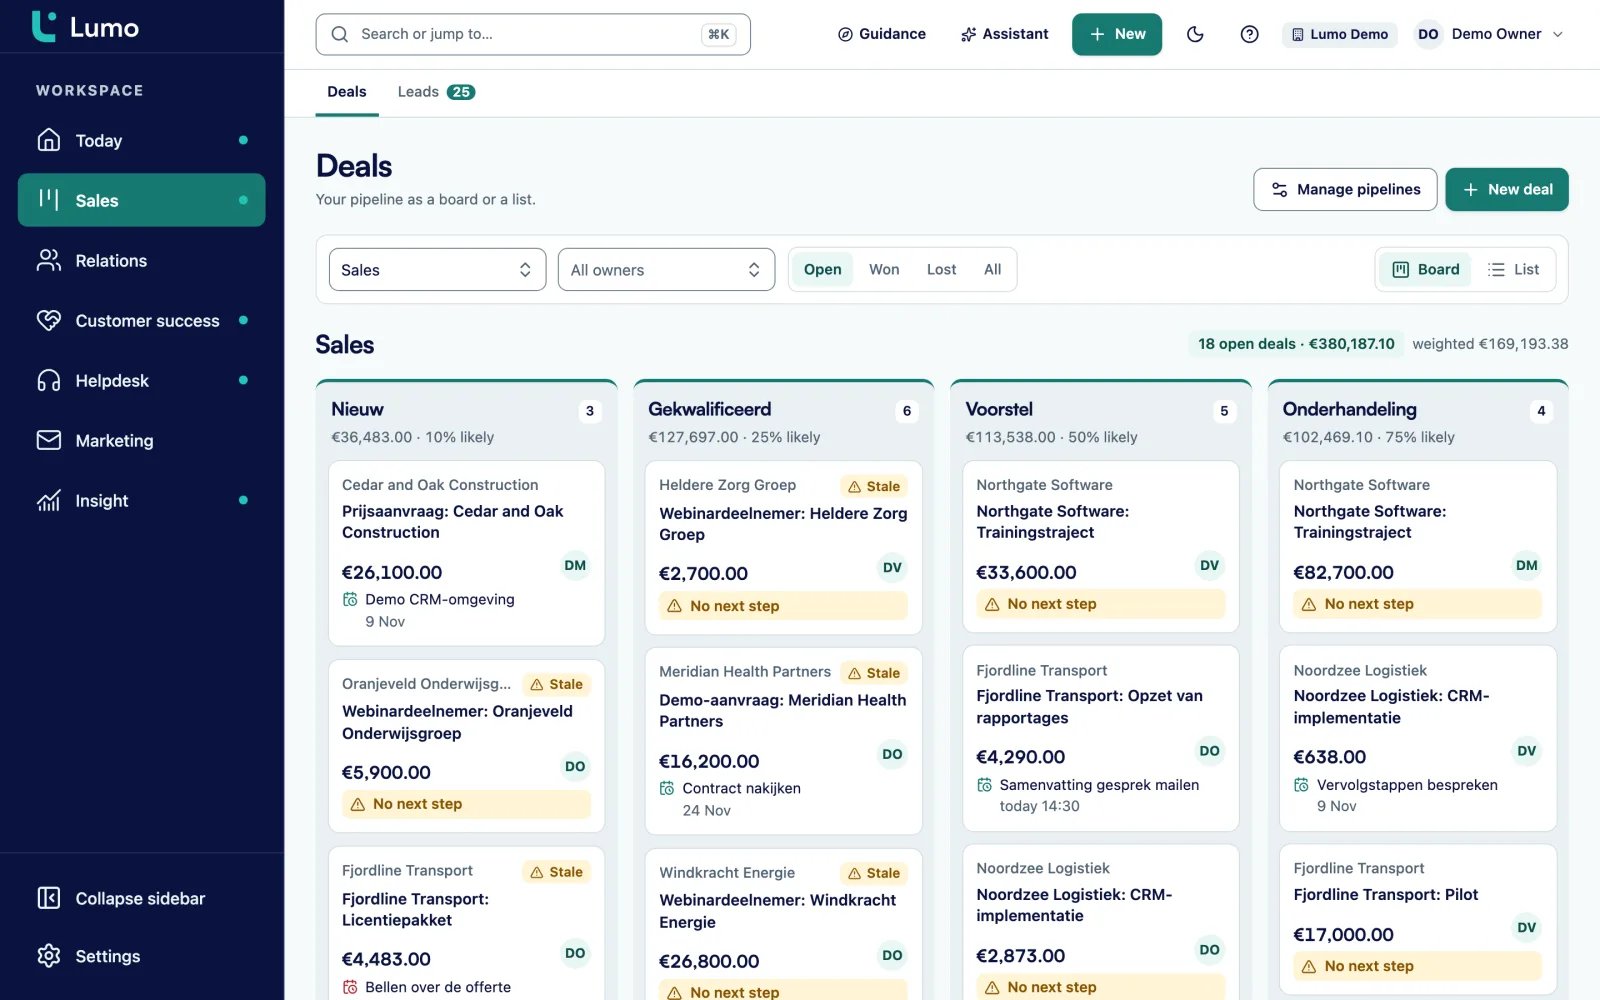
The deal board shows count, value and weighted value per stage. Every stage change is stored with the time a deal spent in the stage, so cycle length per stage is measurable. Lost deals get a reason from a list you manage yourself. Read more about reports and dashboards, pipeline management and the page for sales managers.
Lumo has no separate forecast screen. You build a weighted forecast as a report on deal value times stage win probability, and you keep the day one forecast by recording the dashboard figure at that moment. Scheduled email reports are not available, so open the shared dashboard in the meeting itself. In reports a recurring product counts for one period, while the deal value counts a full year when no number of cycles is set. Agree which number your revenue reports use. And reports see all records in the workspace, so keep that in mind when you share per team.
For most B2B teams: win rate, median deal size, cycle length per stage, pipeline coverage, new pipeline created and lead response time. Together they show both how it went and how it is going.
Won deals divided by won plus lost deals in the same period, on close date. Open deals are left out.
Open deals times win rate times average deal size, divided by cycle length in days. It shows how much revenue moves through your pipeline per day. Watch how it moves over the months.
As a rule of thumb, 1 divided by your win rate. If you win one in three, you need roughly three times your remaining target in pipeline that can close in the period. One in four means four times.
Eight at most on the standing dashboard. More numbers can live in separate reports, but in the meeting you only discuss numbers that have an owner and an action.
Lagging numbers such as won revenue and win rate show how it went. Leading numbers such as new pipeline, coverage and response time show how it is going, so you can still adjust.
Work back from the revenue goal. Divide by your median deal size for the number of deals, by your win rate for the number of closed deals and by your lead conversion for the number of leads. Test that against what the team achieved before.
Record the forecast on the first day of the period and compare it at the end with actual won revenue. The deviation in percent, tracked per month, shows whether your forecast is getting better.
As a way to understand what happens, yes. As a goal by itself, no. You get many short activities without results.
In the demo we build a few of these reports on sample data and show how drilling down to the deals works.